


As gold began its descent from $1190 to a recent low of $1073, certain quarters of the gold investment community began to retell a familiar tale. This drop was engineered by central bankers aided and abetted by unscrupulous investment banks in an attempt to stop gold being the canary in the inflationary mine. I won't quote sources as they are not difficult to find.
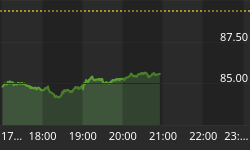
The two charts (courtesy of infomine.com) below show the drop from the 15th October high for gold and the 28th October high for silver. In that time, gold has dropped about 9% and silver has dropped 13%.


I have been a student of conspiracy theories from a long time before I got interested in precious metals. When I did begin buying gold and silver in the late 1990s, it was not long before I was adding the theories of GATA and others to those about Jesuits, Freemasons and the Illuminati.
One may wonder why anyone would put a red cent into gold and silver if these metals are under the thumb of central bankers? But with tales of conspiracy comes tales of redemption as followers are encouraged to buy yet more gold as the day of reckoning draws near for the evil bankers as the so called deception of paper gold over physical gold finally cracks under hyper-demand for the real stuff.
Of course, we know that gold was under the direct manipulation of governments as the price was fixed in a tight range for decades stretching back to the 19th century and before. We know about the London Gold Pool and other gold control schemes, so why the need for secrecy?
I have three questions.
Firstly, gold went from $255 to about $1920 in the course of ten years. That is more than a seven fold increase. Now I would take this to be evidence, at worst, that if there is a gold suppression scheme, it is as useful as a chocolate teapot. At best, it proves it does not exist at all.
Secondly, inflation is currently running at nearly zero percent and has been moving around this level for the whole year. This is well below the Federal Reserve's PCE target of 2%, yet we are told that central banking's attack on gold is more intense than ever. Why does it need to be more intense than ever? Inflation is practically nonexistent; so the gold canary does not even need to clear its throat. Yet the powers that be decide to smash gold?! That doesn't make sense; the Fed needs more inflation now, not less. Or perhaps they're just practicing for the hell of it?
Thirdly, I had a look at the corresponding charts for some base metals.


Basically, all these base metals topped at about the same time as gold and silver. Copper dropped about 8%, lead by about 13%, tin by 12% and zinc by 16%. Compare these to gold's 9% drop and ask yourself whether in fact all these drops have a common cause rather than a secret group gunning for gold? Did the central bankers also smash copper, lead, tin and zinc? I don't think so.
The answer is more likely to lie in a more mundane explanation and that is the US dollar. During this metal downturn, the US Dollar Index rose by 6%. And the reason for all this is nothing to do with clandestine groups, but the fact that a stronger US dollar also weighs on base metals, because it raises the costs for buyers using other currencies.
And that includes precious metals as well. Somebody may quote people like Greenspan intervening in the gold market, but there is a big difference between haphazard interventions and consistent manipulation. For your information, the latest issue of our newsletter addresses a similar misconception about precious metals and the money supply.
Further analysis of silver can be had by going to our silver blog at http://silveranalyst.blogspot.com where readers can obtain subscription details for the Silver Analyst newsletter. Comments and questions are also invited via email to silveranalysis@yahoo.co.uk.


