• 819 days Will The ECB Continue To Hike Rates?
  • 819 days Forbes: Aramco Remains Largest Company In The Middle East
  • 821 days Caltech Scientists Succesfully Beam Back Solar Power From Space
  • 1,221 days Could Crypto Overtake Traditional Investment?
  • 1,226 days Americans Still Quitting Jobs At Record Pace
  • 1,228 days FinTech Startups Tapping VC Money for ‘Immigrant Banking’
  • 1,231 days Is The Dollar Too Strong?
  • 1,231 days Big Tech Disappoints Investors on Earnings Calls
  • 1,232 days Fear And Celebration On Twitter as Musk Takes The Reins
  • 1,234 days China Is Quietly Trying To Distance Itself From Russia
  • 1,234 days Tech and Internet Giants’ Earnings In Focus After Netflix’s Stinker
  • 1,238 days Crypto Investors Won Big In 2021
  • 1,238 days The ‘Metaverse’ Economy Could be Worth $13 Trillion By 2030
  • 1,239 days Food Prices Are Skyrocketing As Putin’s War Persists
  • 1,241 days Pentagon Resignations Illustrate Our ‘Commercial’ Defense Dilemma
  • 1,242 days US Banks Shrug off Nearly $15 Billion In Russian Write-Offs
  • 1,245 days Cannabis Stocks in Holding Pattern Despite Positive Momentum
  • 1,246 days Is Musk A Bastion Of Free Speech Or Will His Absolutist Stance Backfire?
  • 1,246 days Two ETFs That Could Hedge Against Extreme Market Volatility
  • 1,248 days Are NFTs About To Take Over Gaming?
What's Behind The Global EV Sales Slowdown?

What's Behind The Global EV Sales Slowdown?

An economic slowdown in many…

Another Retail Giant Bites The Dust

Another Retail Giant Bites The Dust

Forever 21 filed for Chapter…

  1. Home
  2. Markets
  3. Other

Elliott Wave Analysis On USDJPY And SP500

USDJPY

USDJPY is making a sharp leg up today from 122.25 so we see decline from 123.75 in three legs, thus a corrective move that is part of a bigger complex pattern. We still like a triangle idea in wave four, so current recovery represents wave d) within a sideways range. 123.20/40 can be seen in sessions ahead from where we will look for wave e) pullback.

USDJPY, 1H

USDJPY 1-Hour Elliott Wave Chart


S&P500

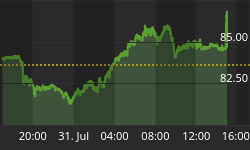
E-mini S&P500 rallied with five waves from 2065 so we stay bullish on stocks after any pullback. Ideally uptrend will resume from around 2080 area, where we see former wave four and 38.2-50% Fibonacci support level. That said, be aware of another leg to the upside, towards 2100.

S&P500, 30 Min

S&P500 30-Minute Elliott Wave Chart


If you like our trading analysis, you can visit our website at --> www.ew-forecast.com


Back to homepage

Leave a comment

Leave a comment