


Last week we said "...Next week is probably going to be light trading volume, with many investors taking time off for the Thanksgiving holiday..." Basically the major indexes ended the week where they began the short trading week.

A standard chart that we use to help confirm the overall market trend is the Momentum Factor ETF (MTUM) chart. Momentum Factor ETF is an investment that seeks to track the investment results of an index composed of U.S. large- and mid-capitalization stocks exhibiting relatively higher price momentum. This type of momentum fund is considered a reliable proxy for the general stock market trend. We prefer to use the Heikin-Ashi format to display the Momentum Factor ETF. Heikin-Ashi candlestick charts are designed to filter out volatility in an effort to better capture the true trend. Last week's analysis is playing out as advertised, "...investors have suddenly turned bullish. Stocks have converted to a confirmed uptrend with room to continue moving higher..." The updated chart shows the bullish trend still pushing higher.

The market was basically on hold during the holiday shortened trading week, therefore recent analysis is still valid "...quarterly results remain solid for equity indexes. Interest rate sensitive asset classes such as bonds and precious metals remain depressed ahead of the Feds December interest rate announcement..."

The American Association of Individual Investors (AAII) Sentiment Survey measures the percentage of individual investors who are bullish, bearish, and neutral on the stock market for the next six months; individuals are polled from the ranks of the AAII membership on a weekly basis. The current survey result is for the week ending 11/25/2015. The most recent AAII survey showed 32.40% are Bullish and 26.00% Bearish, while 41.60% of investors polled have a Neutral outlook for the market for the next six months. Over the past few weeks the AAII survey continues to support range-bound trading.

The Nation Association of Active Investment Managers (NAAIM) Exposure Index represents the average exposure to US Equity markets reported by NAAIM members. The blue bars depict a two-week moving average of the NAAIM managers' responses. As the name indicates, the NAAIM Exposure Index provides insight into the actual adjustments active risk managers have made to client accounts over the past two weeks. The current survey result is for the week ending 11/25/2015. Third-quarter NAAIM exposure index averaged 56.15%. Last week the NAAIM exposure index was 58.47%, and the current week's exposure is 70.45%. Professional money managers have recently converted to "risk-on" trading as they ignore worldwide geopolitical risks and fixate on the improving U.S. economy.

Trading Strategy
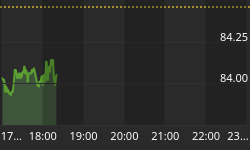
The graph below confirms that consumer stocks falling as investors fretted over early reports on the U.S. holiday shopping season and Disney's subscriber losses weighed on the market. Energy stocks made a big move higher last week as the cost of oil fell due to global oversupply. Otherwise the market was on hold during the holiday shortened trading week. As reported in the Stock Trader's Almanac early December gains tend to fade mid-month, but after the FMOC announcement, be prepared for the usual yearend rally.

Feel free to contact me with questions,


