


The Benchmark S&P 500 Index fell 3.8% for the week. The Blue Chip-heavy Dow Jones Industrial Average's finished the week down 3.3% and the Nasdaq was off by almost 4%. The small cap Russell 2000 led the major indices by falling 5% as the energy components weighed it down. As seen in the updated chart below, the Nasdaq is the only major index above water for the year. The bear market crash in gold prices is partially attributed to impending interest rate hike from near zero by the Fed, in which case gold loses its appeal as a non-interest bearing asset and the strengthening of the dollar, which makes dollar denominated commodities expensive. Higher rates tend to drag on non-interest-paying gold by increasing the opportunity cost of holding the metal. The other reasons of the fall in gold prices are consumption driven, mainly consumption demand from key consumers China and India due to economic.

A standard chart that we use to help confirm the overall market trend is the Momentum Factor ETF (MTUM) chart. Momentum Factor ETF is an investment that seeks to track the investment results of an index composed of U.S. large- and mid-capitalization stocks exhibiting relatively higher price momentum. This type of momentum fund is considered a reliable proxy for the general stock market trend. We prefer to use the Heikin-Ashi format to display the Momentum Factor ETF. Heikin-Ashi candlestick charts are designed to filter out volatility in an effort to better capture the true trend. Last week we said, "...after recovering from the market bottom to start the fourth-quarter, the overall stock market has been contained inside a trading range... Expect this trend to continue until after the Federal Reserve interest rate decision in a few weeks..." Despite last week's market pullback and Friday's massive drop, you can see in the updated chart below how stocks remain in a long term trading range. However, as highlighted, technical indicators are signaling a market sell-off with momentum starting to turn bearish. Next week is absolutely critical with the Fed interest rate decision on Wednesday and triple-witching option expiration at weeks end. If the market follows up on last week's downturn it jeopardizes the year-end price recovery.

A tool to help confirm the overall market trend is the Bullish Percent Index (BPI). The Bullish Index is a popular market "breadth" indicator used to gauge the internal strength/weakness of the market. It is the number of stocks in an index (or sector) that have point & figure buy signals relative to the total number of stocks that comprise the index (or sector). So essentially it is the percentage of stocks that have buy signals. Like many of the market internal indicators, it is used both to confirm a move in the market and as a non-confirmation and therefore divergence indication. If the market is strong and moving up, the BPI should also be moving higher as more and more stocks are purchased. Last week's analysis "...Nasdaq stocks have been the market leader for most of the year...market leader(s) not being able to attain new highs suggests the overall stock market will remain restrained near-term..." The Nasdaq Composite Bullish Percentage Index (BPCOMPQ) chart below signals stocks are in a downtrend. As the market leader, if Nasdaq stocks don't snap back next week it sets up disappointing market performance for the year.

We like to compare the DOW Industrials and Transports to confirm the current market trend. Last week's observation "...DOW Transports have diverged away from the DOW Industrials. This indicates weakness in the current uptrend...unless both indexes converge higher, it will be difficult for the DOW Industrials to continue going up..." The updated chart below validated this analysis as both indexes have now converged lower to confirm a downtrend and market weakness.

In the chart below, the Aggregate Bond ETF (AGG) represents the "bond" market and the Equal-Weight S&P 500 ETF (RSP) is the stock market benchmark. Most market pundits expect the Federal Reserve to start raising interest rates, which should be expected to depress bond prices. But as evidenced in the chart below, as investors dump stocks they are parking the funds in bonds, which is driving up those prices.

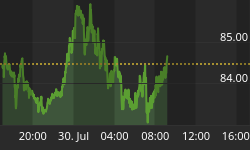
As seen in the chart below, the U.S. dollar plunged last week as the stock market crashed and falling commodity prices overshadowed solid retail sales data and consumer sentiment which may further motivate the Federal Reserve to hike interest rates next week. The dollar had a strong November before turning negative on the view the modest growth in retail spending was not strong enough to support further monetary tightening. "At this point, the market is shifting its focus off next week's Fed rate hike, which has largely been baked in, and on to the path of normalization in 2016," said Omer Esiner, chief market analyst at Commonwealth Foreign Exchange in Washington. Those factors caused traders to exit long dollar positions, said Steve Englander, director and global head of G10 FX strategy at Citigroup, boosting European currencies. Treasury prices spiked higher also as investors were in "Risk-off" mode. The demand for Treasuries sent treasury bonds to their highest level in a month. The anticipated Fed rate increase continues to depress gold prices and other non-interest bearing commodity assets.

Market Outlook
As reported by the Bank of America, on June 29, 2006, the Federal Reserve did something it would not do again for (at least) nine and a half years: it hiked rates by 25 basis points, its 17th consecutive rate hike. Everyone knows what happened afterwards (approximately a year later the market topped out and then descended into a bear market). This coming Wednesday, the Fed is expected to do something it hasn't done for 3,457 days: hike interest rates, ending the longest period in US history (84 months) of zero interest rates. How has the world changed in the interim? Some quick observations from BofA: Back then US housing starts were booming (2¼ million per annum), a stock market bubble was taking place in Saudi Arabia, another one was forming in China, no one had heard of "Quantitative Easing" and there was no such thing as the iPhone. Today, US housing starts are moribund (around 1 million per annum), the Saudi's credit rating has just been downgraded, Chinese debt deflation has reduced China's "growth" opportunity set to babies, tourists & capital outflows, central banks have purchased a remarkable $12,400,000,000,000 of financial assets since Bear Stearns, and the iPhone now powers retail sales. And here is the biggest difference: back then total debt/GDP was 61%, with total debt just over $8 trillion. Now, it is 104%, with the total US debt just shy of $19 trillion.

The continued collapse in oil prices is putting a strain on the overall stock market; weaker-than-expected November retail sales also put a damper on the market while manufacturing and construction continue to lag. The Federal Reserve appears set to initiate its first interest rate hike in almost a decade. But if the Fed does hike rates it won't be coming against a slew of enormously strong economic data. One piece of data of note was that inflation measured by the PPI was surprisingly solid. It is as if investors are already punishing stocks for the upcoming hike and we will find out for sure on Wednesday. Activity in the options market suggests stock traders are being cautious ahead of the FOMC two-day policy meeting on Tuesday and Wednesday, and options expiration at the end of next week could amplify volatility in either direction. "If policymakers came out saying that over the next two years they will raise by 'this' much, that would be very destabilizing," said Brian Battle, director of trading at Performance Trust Capital Partners in Chicago. "The market will take great relief in the Fed communicating it will be very patient for the next increase." This uncertainty has helped trigger bets in the options market by investors trying to cover themselves against a wide array of outcomes in stocks, and similar uncertainty has been apparent across other asset classes as well. Also, keep in mind that next week is a triple witching week (when the contracts for stock index futures, stock index options and stock options all expire on the same day) this typically increases market volatility.

The CBOE Volatility Index (VIX) is known as the market's "fear gauge" because it tracks the expected volatility priced into short-term S&P 500 Index options. When stocks stumble, the uptick in volatility and the demand for index put options tends to drive up the price of options premiums and sends VIX higher. As stocks fell sharply at weeks end, volatility finished up sharply. The 'Fear Gauge' jumped an unbelievable 65% last week but it was off of a support level near $15. As highlighted in the weekly chart below, the last time the Volatility Index surged the way it did this week was during the market correction in August. Similar to what happened in August, if the VIX tops out after the FOMC decision and option expiration next week; volatility should subside as stock prices recover going into year end.

The American Association of Individual Investors (AAII) Sentiment Survey measures the percentage of individual investors who are bullish, bearish, and neutral on the stock market for the next six months; individuals are polled from the ranks of the AAII membership on a weekly basis. The current survey result is for the week ending 12/09/2015. The most recent AAII survey showed 28.50% are Bullish and 29.90% Bearish, while 41.60% of investors polled have a Neutral outlook for the market for the next six months. Recent remarks are still valid "...The AAII survey continues to support the current trading environment where there are daily up and down triple-digit price moves. We expect this trend to sustain at least until the December 16th FOMC interest rate decision..." We have to see how the upcoming Wednesday Fed announcement will influence individual investors' sentiment heading into year-end.

The Nation Association of Active Investment Managers (NAAIM) Exposure Index represents the average exposure to US Equity markets reported by NAAIM members. The blue bars depict a two-week moving average of the NAAIM managers' responses. As the name indicates, the NAAIM Exposure Index provides insight into the actual adjustments active risk managers have made to client accounts over the past two weeks. The current survey result is for the week ending 12/09/2015. Third-quarter NAAIM exposure index averaged 56.15%. Last week the NAAIM exposure index was 68.12%, and the current week's exposure is 67.92%. Professional money managers are going through the year-end process of selling off investments for tax reasons and rotating out of poor performing sectors into winning stock groups to display on their books for year-end window dressing. Market activity can be expected to slow down after the FOMC meeting and triple-witching option expiration next week as traders start taking time off for the holiday.

Trading Strategy
Next week is absolutely critical for setting up how the stock market can be expected to perform for the year 2015. If the FOMC announces a rate hike on Wednesday as most pundits expect and signals that future rate hikes will be small and gradual, then that could cause stocks to pop. Investors may interpret the Fed's move as a sign that it is still confident about the economy and job market despite the worries about commodity prices and slowing economic growth overseas. "As long as the Fed hikes rates, there could be a relief rally," said Michael Arone, chief investment strategist with State Street Global Advisors. The S&P 500 and Nasdaq indexes have already fell more than 3% this month. Investors may be pushing the expected start of the Santa Claus rally earlier and earlier each year, similar to retailers putting out their Christmas merchandise the day after Halloween. But the market typically jumps higher at the end December after many traders start holiday vacation. Stocks can have exaggerated moves on low volume. "After the Fed meeting, a lot of big investors are off to St. Kitts or the slopes," Arone quipped. "There will be a lack of liquidity that could drive stocks higher." The chart below confirms that's exactly what happened last year. As noted in the weekly S&P 500 Index weekly chart below, stocks plunged at exactly this time last year, only to recover in the following weeks. If the market does not replicate last year's behavior and bounce back after the FOMC meeting and option expiration next week that will jeopardize the major equity indexes positive gains for the year.

As reported by Jeff Hirsh in the Almanac Trader, traditionally December's option expiration is usually very bullish. In fact, the week of options expiration and the week after have the most bullish record of all the so-called Triple Witching weeks (when the contracts for stock index futures, stock index options and stock options all expire on the same day). However, the record is not perfect. In 2011, Europe's debt crisis derailed the market. In 2012, the threat of going over the fiscal cliff triggered a nearly 2% loss the week after. This year, the Federal Reserve may or may not raise interest rates next week. Tech stocks Facebook, Amazon, Netflix and Google got so hot, so hyped and so dominant that they earned the acronym "FANG" stocks. The big four also posted extraordinary gains this year so huge, that they were responsible for most, if not all, of the gains in the market-cap weighted Nasdaq composite. As seen in the graph below, Cyclicals and Consumer Staples are holding up the best during the current market pullback. If stocks pop at year-end as they normally do these sectors can be expected to lead the charge.

Feel free to contact me with questions,


