


"That [half a dollar of buying] frenzy was not stackers lining up to buy phyz. It was speculators buying paper.
Why does that matter? Speculators, who typically use leverage, can't hold the market price against the tide of the hoarders. They can push for a while, but they have to close their positions sooner or later, either to take profits (as they reckon them, in dollars) or to stop losses."
This is what we wrote last week. It turned out to be prescient. This week, the price of silver gave up all of that and more, ending at $13.91. That's down 63 cents.
We don't believe that labor reports drive the prices of the monetary metals. Labor reports may be a driver of the Fed's interest rate decisions. Maybe (we think the Fed cares most about three things: its own solvency, bank solvency, and the government's endless need to borrow more).
In any case, speculators certainly do not drive the price of metal. Just not durably. Sometimes they can distort it for longer (as we recall happened in the summer of 2013) and sometimes they are a flash in the pan. This is one reason why we watch the basis. It is a measure of speculators vs. hoarders. Only the latter, only monetary reservation demand, can permanently drive the prices of the metals up to whatever level.
It's the flip side of the collapse of the dollar. The value of the dollar is not 1/P (price level) nor 1 / N (quantity of dollars). It's whatever people will pay for it. That is ounces of gold. Or more like milligrams at this point.
Gold is not going anywhere (though silver can go up and down, in gold terms). It's the dollar that mostly goes down, though not this week in silver terms! The dollar is now up to 2¼ grams of silver.
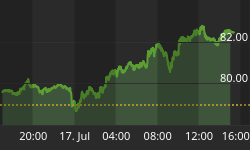
Read on for the only true look at the fundamentals of gold and silver. But first, here's the graph of the metals' prices.
The Prices of Gold and Silver

We are interested in the changing equilibrium created when some market participants are accumulating hoards and others are dishoarding. Of course, what makes it exciting is that speculators can (temporarily) exaggerate or fight against the trend. The speculators are often acting on rumors, technical analysis, or partial data about flows into or out of one corner of the market. That kind of information can't tell them whether the globe, on net, is hoarding or dishoarding.
One could point out that gold does not, on net, go into or out of anything. Yes, that is true. But it can come out of hoards and into carry trades. That is what we study. The gold basis tells us about this dynamic.
Conventional techniques for analyzing supply and demand are inapplicable to gold and silver, because the monetary metals have such high inventories. In normal commodities, inventories divided by annual production (stocks to flows) can be measured in months. The world just does not keep much inventory in wheat or oil.
With gold and silver, stocks to flows is measured in decades. Every ounce of those massive stockpiles is potential supply. Everyone on the planet is potential demand. At the right price, and under the right conditions. Looking at incremental changes in mine output or electronic manufacturing is not helpful to predict the future prices of the metals. For an introduction and guide to our concepts and theory, click here.
Next, this is a graph of the gold price measured in silver, otherwise known as the gold to silver ratio. The ratio jumped sharply this week. Silver got cheaper in gold terms, down to under 1/77 ounce of gold per ounce of silver. Where to from here? Below, we will provide our assessment.
The Ratio of the Gold Price to the Silver Price

For each metal, we will look at a graph of the basis and cobasis overlaid with the price of the dollar in terms of the respective metal. It will make it easier to provide brief commentary. The dollar will be represented in green, the basis in blue and cobasis in red.
Here is the gold graph.
The Gold Basis and Cobasis and the Dollar Price

The cobasis (i.e. scarcity of gold) and price of the dollar (which is inverse of the price of gold, measured in dollars) continue to track. Kinda. Note that this week, the price of the dollar about 0.3mg gold, but the cobasis is down. Gold became less scarce while its price fell.
Not that much. Only a little.
The fundamental price is holding steady, just under $100 and therefore about $120 over the market price.
Now let's look at silver.
The Silver Basis and Cobasis and the Dollar Price

In silver, the picture is the same. Only uglier.
The price of the dollar in silver terms made a new high for the move. The cobasis isn't really breaking out. The silver fundamental price is down almost 40 cents from last week (like everything else about silver, the fundamental price is more volatile than that of gold). It's still above the market, but not by a lot -- around 40 cents.
If you divide the fundamental gold price by the fundamental silver price, you get the fundamental gold to silver ratio.
Dare we risk printing the number, without generating too much hate mail?
OK. OK... 83.
Like any fundamental calculation of value, there is no guarantee that the market price will hit the fundamental value. And of course fundamental value is changing all the time too. That said, the fundamental ratio is 7.5% over the market price. That has to be a strong pull.


