


The Benchmark S&P 500 Index and Blue Chip-heavy Dow Jones Industrial Average ended the week with their worst two-day sell off since September 1st. All the major indexes finished the week flat with the S&P 500 down .3% for the week, the DOW fell .8% and Nasdaq lost .2%. As seen in the updated chart below, the Nasdaq remains the only major index in the black for the year.

A tool to help confirm the overall market trend is the Bullish Percent Index (BPI). The Bullish Index is a popular market "breadth" indicator used to gauge the internal strength/weakness of the market. It is the number of stocks in an index (or sector) that have point & figure buy signals relative to the total number of stocks that comprise the index (or sector). So essentially it is the percentage of stocks that have buy signals. Like many of the market internal indicators, it is used both to confirm a move in the market and as a non-confirmation and therefore divergence indication. If the market is strong and moving up, the BPI should also be moving higher as more and more stocks are purchased. Last week's analysis "...The Nasdaq Composite Bullish Percentage Index (BPCOMPQ) stocks are in a downtrend. As the market leader, if Nasdaq stocks don't snap back next week it sets up disappointing market performance for the year..." As highlighted in the updated chart below, the BPCOMPQ downtrend ended. Nasdaq stocks have led all year and breaking out of the downtrend needed to happen for the market have a chance to finish the year on a strong note.

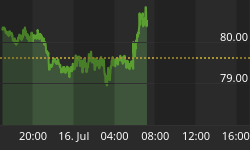
Last week the Federal Reserve announced the first interest rate increase in almost a decade. Higher interest rates in the U.S. increase the return on dollar-denominated deposits, making them more attractive for foreign investors. As seen in the chart below, The U.S. dollar moved back towards a two-week high against a basket of other major currencies on Thursday a day after the Federal Reserve hiked interest rates, on the view that the central bank's move would make U.S. assets more attractive. Generally, the dollar has an inverse relationship to commodities and you can see that as the dollar is surging higher, the commodity index (CRB) is in freefall.

Market Outlook
Last week's analysis mentioned "...options expiration at the end of next week could amplify volatility in either direction...next week is a triple witching week (when the contracts for stock index futures, stock index options and stock options all expire on the same day) this typically increases market volatility..." This analysis played out as advertised with the S&P 500 and DOW ending the week with the largest two-day drop since the beginning of September, including Friday's 367 drop in the DOW, the fourth biggest daily decline this year. The mass selling was precipitated by several factors including renewed concerns about the impact of the Federal Reserve's first interest rate hike in almost a decade and the pace future increases. Even though the rate hike represents the Feds confidence in the U.S. economy, it comes during a delicate time for the global economy amid China's slowdown. Another factor contributing to the selling is fund redemptions where investors have been aggressively pulling money out of hedge funds, mutual funds, ETF's etc. as prices have started crashing. With traders starting to take holiday sabbaticals the next few weeks trading volume should be lighter than normal. This provides an opportunity for the stock market to recover as it normally does going into year-end because market moves can be exaggerated on lighter volume.

The American Association of Individual Investors (AAII) Sentiment Survey measures the percentage of individual investors who are bullish, bearish, and neutral on the stock market for the next six months; individuals are polled from the ranks of the AAII membership on a weekly basis. The current survey result is for the week ending 12/16/2015. The most recent AAII survey showed 23.90% are Bullish and 39.40% Bearish, while 36.80% of investors polled have a Neutral outlook for the market for the next six months. As a reliable contra-indicator, the current AAII survey signals a near term upward move based on individual investors excessively low bullish sentiment. In the past we have pointed out how retail investors are usually behind the curve related to guessing the markets' direction.

The Nation Association of Active Investment Managers (NAAIM) Exposure Index represents the average exposure to US Equity markets reported by NAAIM members. The blue bars depict a two-week moving average of the NAAIM managers' responses. As the name indicates, the NAAIM Exposure Index provides insight into the actual adjustments active risk managers have made to client accounts over the past two weeks. The current survey result is for the week ending 12/16/2015. Third-quarter NAAIM exposure index averaged 56.15%. Last week the NAAIM exposure index was 67.92%, and the current week's exposure is 61.32%. Last week we said, "...Professional money managers are going through the year-end process of selling off investments for tax reasons and rotating out of poor performing sectors into winning stock groups to display on their books for year-end window dressing. Market activity can be expected to slow down after the FOMC meeting and triple-witching option expiration next week as traders start taking time off for the holiday..." You can see that equity exposure is already tapering off as money managers start taking holiday vacation.

Trading Strategy
Next week is the week after December triple-witching option expiration, which has a historically bullish record. As seen in the graph below, over the past month Consumer Staples is the only positive performer compared to the other major S&P equity sectors. If stocks jump at year-end as they normally do this sector can be expected to lead the charge.

Feel free to contact me with questions,


