


The stock market is reacting to the four "black swan" events since the year started (the heated Iran/Saudi Arabia conflict, China's stock market drop, North Korea's bomb testing and China's Yuan devaluation). The S&P 500 posted a weekly loss of 6% and the Dow Jones Industrial Average dropped 6.2%. It was the worst weekly percentage loss for stocks since September 23rd, 2011. This also marks the worst opening week of the year in history for both the S&P 500 and the Dow. Meanwhile, the Nasdaq Composite ended down 7.3% over the week. The chart below indicates stocks have actually been in the crapper the past six months. During this time the major equity indexes have only briefly been above water before the bottom really fell out the past few weeks. Treasury bonds are the only asset class to hold up consistently.

A standard chart that we use to help confirm the overall market trend is the Momentum Factor ETF (MTUM) chart. Momentum Factor ETF is an investment that seeks to track the investment results of an index composed of U.S. large- and mid-capitalization stocks exhibiting relatively higher price momentum. This type of momentum fund is considered a reliable proxy for the general stock market trend. We prefer to use the Heikin-Ashi format to display the Momentum Factor ETF. Heikin-Ashi candlestick charts are designed to filter out volatility in an effort to better capture the true trend. The chart below confirms stocks are in the strongest downtrend since the end of September. However, the orange circles mark where the strength indicator is extremely oversold and stocks usually start a recovery when at this level.

Taking a look at the weekly MTUM chart to perform further analysis shows the price is at the 50-week moving average support level. As highlighted in the chart, this support has held firm for several years and the MTUM usually recovers higher the week after falling to this point.

As seen in the chart below, the U.S. dollar plunged last week as the stock market crashed. Treasury yields sank as investors sought the safety of government bonds in response to the massive selloff in global equity and commodity markets that were triggered by devaluation in China's currency and mayhem in the country's stock market. Falling yields equate to rising treasury prices. Investors bid gold prices to the highest level in almost three months as they seek safe havens during the global stock market meltdown.

Market Outlook
The stock could be in for a turbulent year as history indicates that the trading in the first week of a new year could influence the direction of the market for the rest of the year. According to the WSJ Market Data Group the first week of the New Year has predicted the direction of the S&P 500 index 68% of the time. The correlation is 66% for the Dow Jones Industrial Average. However, the predictive power of the first week of trading tends to be more relevant when the market is going up rather than down. In fact, during years when the market is down, the first week's performance as an indicator is basically 50/50, according to Wall Street Journal data.
If there is any consolation to the miserable start to the New Year, it may be that the sizable selloff has triggered a "buy" signal from a technical perspective with 88% of all global equity markets trading below their 200-day moving average and 50-day moving average according Michael Hartnett, chief investment strategist at Bank of America Merrill Lynch. There hasn't been a bear market in the U.S. since the Great Recession. And even after the atrocious start to the current year, Wall Street still is not approaching a bear market. The major indexes have to plunge 20% below their previous high to be in bear market territory. The S&P 500 is down about 9% from its record highs of last year. The Dow and Nasdaq ended the week down 10%, officially falling into correction mode. But lurking beneath the surface, the outlook appears a lot worse. As of Friday almost half of the stocks in the S&P 500 have crumbled at least 20% below their 52-week highs, according to FactSet data. Small-cap stocks are considered more risky than large caps and are getting hit a lot harder. The average small-cap stock is now down nearly 30% from its peak, putting it firmly in bear-market status. "So many things are breaking down that the chance of the overall market breaking down is higher than at any time in several years," said Ryan Detrick, an independent market strategist. "I don't see another bear market. The true bear markets happen when the economy goes into recession. This economy is not falling off a cliff," said Detrick. The graph below confirms investors have gone completely "risk off" as they dump equities and are buying safe-haven assets like gold and bonds.
As mentioned previously, some technical indicators are signaling an imminent countertrend recovery bounce and there is still a lot of time for the market to rebound and finish January with a gain. A positive January Barometer reading improves the full-year outlook, especially with the recent penchant for the market to rebound just as sharply as it sells off.

Put/Call Ratio is the ratio of trading volume of put options to call options. The Put/Call Ratio has long been viewed as an indicator of investor sentiment in the markets. Times where the number of traded call options outpaces the number of traded put options would signal a bullish sentiment, and vice versa. Technical traders have used the Put/Call Ratio for years as an indicator of the market. Most importantly, changes or swings in the ratio are seen as instances of great importance as this is commonly viewed as a change in the tide of overall market sentiment. The current ratio indicates traders are extremely bearish during the current downturn as they load up on option put contracts to protect against further market declines.

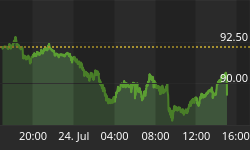
The CBOE Volatility Index (VIX) is known as the market's "fear gauge" because it tracks the expected volatility priced into short-term S&P 500 Index options. When stocks stumble, the uptick in volatility and the demand for index put options tends to drive up the price of options premiums and sends VIX higher. As stocks had the worst first week of the year in recorded history, volatility finished up sharply. As highlighted in the chart below, the 'Fear Gauge' jumped back up to the resistance price that was established in September. Also the VIX is close to being overbought where is can be expected to pull back if earnings season starts out well.

The American Association of Individual Investors (AAII) Sentiment Survey measures the percentage of individual investors who are bullish, bearish, and neutral on the stock market for the next six months; individuals are polled from the ranks of the AAII membership on a weekly basis. The current survey result is for the week ending 01/06/2016. The most recent AAII survey showed 22.20% are Bullish and 38.30% Bearish, while 39.60% of investors polled have a Neutral outlook for the market for the next six months. Individual investors have been turning extremely negative as the market moves into correction territory. As a reliable contra indicator the current AAII survey signals a short-term counter trend bounce based on retail investors' overly bearish sentiment.

The Nation Association of Active Investment Managers (NAAIM) Exposure Index represents the average exposure to US Equity markets reported by NAAIM members. The blue bars depict a two-week moving average of the NAAIM managers' responses. As the name indicates, the NAAIM Exposure Index provides insight into the actual adjustments active risk managers have made to client accounts over the past two weeks. The current survey result is for the week ending 01/06/2016. Fourth-quarter NAAIM exposure index averaged 44.61%. Last week the NAAIM exposure index was 47.67%, and the current week's exposure is 50.26%. Professional money managers are reducing equity exposure during the current market selloff. Quarterly earnings season begins next week and favorable financial reports might encourage investors to maintain or increase equity exposure.

Trading Strategy
Trader mentality has switched from years of buying dips to 'Selling Rallies' based on the action the last few months. In the graph below the only winning S&P 500 sector over the past month is Utilities. Similar to Treasury bonds, investors are putting funds into Utility company stocks as a safe-haven during the current market turmoil. FANG stocks (Facebook, Amazon, Netflix and Google) are holding up better than the rest of the market. These stocks might be the best bet for investors looking to trade a countertrend bounce because they will probably lead the recovery. Also, the Dollar was the top-performing asset last year excluding dividends, so sitting on cash is always a sound investment during market uncertainty.

Feel free to contact me with questions,


