


Gold has done little price-wise since the last update - it has continued to track sideways unwinding the overbought condition that developed as a result of the breakout in September. At first sight this trading range looks like a period of consolidation that should be followed by renewed advance, but with regard to the short-term outlook, there are several reasons for some caution at this time.

On the 1-year chart we can see that the trading range following the September rally is starting to look like a small Head-and-Shoulders top. Given the support that now exists at the top of the 9-month trading range that preceded the breakout, we would not normally take this apparent Head-and-Shoulders top seriously, but there are several important factors that we will come to shortly which are signalling that the danger of a breakdown from this pattern and consequent short-term retreat should not be underestimated. But before leaving the 1-year chart, there are several other technical points that are worthy of note. The first is that there is a clear support level at $460 and the fact that the 50-day moving average is now approaching this level is an indication that the chances of a breakout from the trading range, one way or the other, are now increasing rapidly. Normally in this situation, following the strong September breakout, the approach of this average would lead to an upside breakout, but the adverse factors already alluded to, couple with the increasingly large gap between the 50 and 200-day moving averages, mean that the risk of a downside break and retreat back towards the 200-day moving average cannot be ignored.
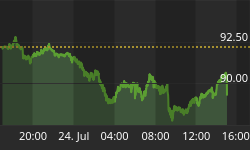
The biggest factor threatening a short-term downside break is the dollar, which is looking strong and is in position to take out important resistance in the 90.5 - 92 area on the index. On the 5-year dollar index chart, we can see that the moving averages have swung into bullish alignment, increasing the chances of the dollar breaking above the clear resistance level shown. This is an important juncture for the dollar as if it doesn't overcome this resistance level soon, it is likely to enter another period of decline.

Another factor that increases the chances of gold breaking down short-term is the non-confirmation of gold's breakout by the gold stock indices, which have refused to break out to new high, despite gold's clear breakout.
We will finish by considering the long-term 5-year chart for gold, in order to put any near-term breakdown from the recent trading range into perspective. As should be clear from a glance at the 5-year chart, a breakdown from this trading range, which would be signalled by a breakdown below $460, would not be a seriously bearish development for gold, as the price can afford to drop back into the $440 area without the larger pattern suffering any real technical damage - on the contrary, this would set it up for another run and would doubtless throw up another buying opportunity in gold stocks, with the HUI index probably retreating back towards the lower boundary of the large trading range, looked at in some detail in the last Marketwatch. If this happens, it will be time to buy with relatively close stops beneath the nearby strong support.


