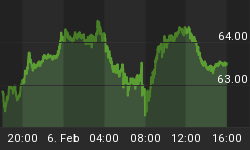
Nasdaq 100 (NDX), IWM (Russell 2000 etf) and SP500 (SPX) are displaying a corrective pattern. If the count that I am following is correct the wave (C) of a Zig Zag is underway.
Once the assumed wave (C) is done a sustainable bottom could be in place.
A wave (C) can either be impulsive or Ending Diagonal.
If it is impulsive the current bounce should be almost done. A substantial move above the 0.5 retracement of the assumed wave (3) would jeopardize this scenario.
If it is an Ending Diagonal the rebound could last several weeks.
- Nasdaq 100 (NDX): The Strongest (It is not displaying a sequence of lower high/low)
- It has a huge monthly gap down
- Price is below the 10 mma
- But it has not tested the August low
- January ends with a large bottoming tail (Hammer)
Weekly time frame
- It does not have a clear ending pattern and it even achieved a new 52 w high on December
- From the summer high maybe it is unfolding a Flat correction (ABC) pattern
- Second Hammer candlestick from the January low is suggesting that the rebound is not over yet
- Resistance 1 at 4344 and Resistance 2 = 4451
Daily time frame
- The decline from the December high can be counted as a wave (C), like SP 500 (SPX) and the DJIA. If it is a wave (C) it has to be impulsive or an Ending Diagonal. So far it could be impulsive in which case the current bounce is a wave (4).
- Friday's rally has shaped a white Marubozu with the hod at the 20 dma. Often a Marubozu is followed by a small range body
- The support is located at Friday's break out at 4260
- The next resistance is located at 4360 which coincides with the 0.5 retracement of the assumed wave (3) and the equality extension target of the 3-wave up leg rebound from the January's lod
- Above 4360 the impulsive wave (C) scenario will be jeopardized
- IWM (Russell 2000 etf): The weakest
Monthly time frame:
- Sequence of lower high/low
- Price is below the 10 mma
- It has breached the trend line from the 2009 low and almost tagged the 0.382 retracement of the entire advance from the 2009 low
- The Resistance 1 is located at 103.6; Resistance 2 at 107
- January ends with a large bottoming tail (Hammer)
Weekly time frame:
- There is a potential ending pattern at the June top
- It also displays a 3-wave down leg from the June high
- It seems probable that the rebound from the January low is not over yet
- The major resistances are the same highlighted in the monthly time frame
Daily time frame
- Another white Marubozu on Friday
- The support is located at Friday's break out at 101.60
- The 20 dma is slightly above Friday's hod
- If the wave (C) is impulsive the current rebound is also a wave (4) which should not breach the resistance zone at 107 ish
- Above 107 the impulsive wave (C) scenario will be jeopardized
- SP 500 (SPX)
Monthly time frame
- Sequence of lower high/low
- Price is below the 10 mma
- January ends with a large bottoming tail (Hammer)
Weekly time frame
- There is a potential ending pattern at the May high
- The decline from the May high can be counted as a corrective 3-wave down leg
- Two consecutive Hammer candlesticks are suggesting that the rebound from the January low is not over yet
- The resistance levels are R1 at 1950; R2 at 1972 and R3 at 1993
Daily time frame
- Another White Marubozu on Friday
- SP 500 has reclaimed with authority the 20 dma, showing relative strength
- Support is located at the 20 dma = 1925
- The immediate resistance is at 1950 then we have 1961
- Above 107 the impulsive wave (C) scenario will be jeopardized
- The RSI (14) has breached its trend line resistance
- The MACD has a new bullish signal cross
- If this is the wave (4) there should be more upside until the RSI(5) enters the overbought zone
In the technical front:
- The McClellan Oscillator is displaying a breadth thrust. Above the overbought line the buying pressure could be rejected


