• 764 days Will The ECB Continue To Hike Rates?
  • 764 days Forbes: Aramco Remains Largest Company In The Middle East
  • 766 days Caltech Scientists Succesfully Beam Back Solar Power From Space
  • 1,166 days Could Crypto Overtake Traditional Investment?
  • 1,170 days Americans Still Quitting Jobs At Record Pace
  • 1,172 days FinTech Startups Tapping VC Money for ‘Immigrant Banking’
  • 1,175 days Is The Dollar Too Strong?
  • 1,176 days Big Tech Disappoints Investors on Earnings Calls
  • 1,177 days Fear And Celebration On Twitter as Musk Takes The Reins
  • 1,178 days China Is Quietly Trying To Distance Itself From Russia
  • 1,179 days Tech and Internet Giants’ Earnings In Focus After Netflix’s Stinker
  • 1,183 days Crypto Investors Won Big In 2021
  • 1,183 days The ‘Metaverse’ Economy Could be Worth $13 Trillion By 2030
  • 1,184 days Food Prices Are Skyrocketing As Putin’s War Persists
  • 1,186 days Pentagon Resignations Illustrate Our ‘Commercial’ Defense Dilemma
  • 1,186 days US Banks Shrug off Nearly $15 Billion In Russian Write-Offs
  • 1,190 days Cannabis Stocks in Holding Pattern Despite Positive Momentum
  • 1,190 days Is Musk A Bastion Of Free Speech Or Will His Absolutist Stance Backfire?
  • 1,191 days Two ETFs That Could Hedge Against Extreme Market Volatility
  • 1,193 days Are NFTs About To Take Over Gaming?
Is The Bull Market On Its Last Legs?

Is The Bull Market On Its Last Legs?

This aging bull market may…

Zombie Foreclosures On The Rise In The U.S.

Zombie Foreclosures On The Rise In The U.S.

During the quarter there were…

  1. Home
  2. Markets
  3. Other

Elliott Wave Analysis On GBPUSD And SP500

GBPUSD

GBPUSD made a strong bearish leg after the price took out 1.4560 level at the start of January. Notice that current decline is extended, so it must be impulsive as part of a much bigger bearish cycle. However, price reached our Fibonacci projected levels for current wave 3-circled where bearish waves could slow down; but it may not be for long as current bounce will be treated as a correction within ongoing weakness towards 1.4000. However, wave 4-circled can recover back to 1.4560 before downtrend resumes.

GBPUSD, Daily

GBPUSD Daily Chart


S&P500

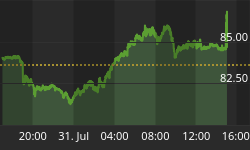
No change here on E-mini S&P500 for now; we still see price in minor fourth wave as part of wave C that can reach levels near 1940 before upside can be limited for a new turn down. Whole structure from Jan 19th low looks like a corrective move that can cause new turn down very soon, and push beneath 1888 will likely suggests that bears are already here.

S&P500,1H

S&P500 1-Hour Chart


If you like our trading analysis, you can visit our website at --> www.ew-forecast.com


Back to homepage

Leave a comment

Leave a comment