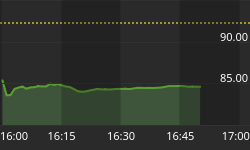
• 685 days Will The ECB Continue To Hike Rates?
  • 686 days Forbes: Aramco Remains Largest Company In The Middle East
  • 687 days Caltech Scientists Succesfully Beam Back Solar Power From Space
  • 1,087 days Could Crypto Overtake Traditional Investment?
  • 1,092 days Americans Still Quitting Jobs At Record Pace
  • 1,094 days FinTech Startups Tapping VC Money for ‘Immigrant Banking’
  • 1,097 days Is The Dollar Too Strong?
  • 1,097 days Big Tech Disappoints Investors on Earnings Calls
  • 1,098 days Fear And Celebration On Twitter as Musk Takes The Reins
  • 1,100 days China Is Quietly Trying To Distance Itself From Russia
  • 1,100 days Tech and Internet Giants’ Earnings In Focus After Netflix’s Stinker
  • 1,104 days Crypto Investors Won Big In 2021
  • 1,104 days The ‘Metaverse’ Economy Could be Worth $13 Trillion By 2030
  • 1,105 days Food Prices Are Skyrocketing As Putin’s War Persists
  • 1,107 days Pentagon Resignations Illustrate Our ‘Commercial’ Defense Dilemma
  • 1,108 days US Banks Shrug off Nearly $15 Billion In Russian Write-Offs
  • 1,111 days Cannabis Stocks in Holding Pattern Despite Positive Momentum
  • 1,112 days Is Musk A Bastion Of Free Speech Or Will His Absolutist Stance Backfire?
  • 1,112 days Two ETFs That Could Hedge Against Extreme Market Volatility
  • 1,114 days Are NFTs About To Take Over Gaming?
The Problem With Modern Monetary Theory

The Problem With Modern Monetary Theory

Modern monetary theory has been…

What's Behind The Global EV Sales Slowdown?

What's Behind The Global EV Sales Slowdown?

An economic slowdown in many…

Is The Bull Market On Its Last Legs?

Is The Bull Market On Its Last Legs?

This aging bull market may…

  1. Home
  2. Markets
  3. Other

Elliott Wave Analysis On AUDUSD And GOLD

AUDUSD

AUDUSD is at the highs with five waves up within a red wave v) while we see a divergence on the RSI. Also leg up from 0.7000 is looking very extended so we think that upside can be limited at 0.7230-0.7260 area. That said, traders must be aware of a pullback to lower levels, with minimum in three waves possibly even back to 0.7150 in sessions ahead. Break of wave iv low at 0.7204 would be important evidence that top of wave v) is in.

AUDUSD, 1H

AUDUSD 1-Hour Chart


GOLD

Gold is higher and it reached our Fibonacci projection area that can be very important for the next few sessions. We are wondering if decline from here can be strong or will be only a new pullback within uptrend. We will need more price data for sure, but as it looks right now we assume that some lower price can occur soon, especially if we consider that there was a triangle formation near 1140. Keep in mind that breakout of a triangle is final leg within larger structure.

GOLD, 30 Min

Gold 30-Minute Chart


If you like our trading analysis, you can visit our website at --> www.ew-forecast.com


Back to homepage

Leave a comment

Leave a comment