


Investment Outlook Summary
-
The financial markets started 2016 on a sour note. The first week of 2016 was the worst first week in market history (S&P500 -6.0%), as investors panicked over disappointing news from China and fears of a global recession. After an 12.8% peak-to-trough decline in January, the S&P 500 closed the month down 5.5%. While it is clear we are in a correction, this unprecedented decline, coupled with the weak rally in the fourth quarter leads us to believe that we are in a bear market and that investors should reduce their equity exposure into the current oversold rally.
-
The Fed waited too long to raise rates, and now they are tightening into an economic slowdown. Market based indicators -- credit spreads, the yield curve, inflation expectations and market breadth -- indicate that the economy is headed for a significant slowdown or recession. In our view, the Fed finally raised rates for political, not economic reasons. We believe U.S Treasury Bonds will perform well in such an environment and we expect them to outperform equities on an absolute and relative basis.
-
We remain circumspect and believe that the stock market offers a very poor long-term risk-reward. Six years of easy money due to the Fed's financial repression policy -- 0% interest rates, negative real rates, QE (printing money), and jawboning the financial markets -- drove risk assets far from their intrinsic value. Now, the Fed is raising rates and reducing liquidity, just as the economy is slowing, profits margins are contracting and earnings are in recession. We believe that a weekly close by the S&P 500 below the August market low (1867) will confirm that we are in a bear market. While the typical bear market is a 32.4% decline, we estimate that fair value on the S&P 500 is 1265, down 41% from the all-time high set last May.
-
A Chinese slowdown is a significant problem for the global economies. Since the 2008 global recession, China was responsible for 44% of global GDP growth. Unfortunately, China's rapid growth led to significant malinvestment, overcapacity and a massive credit bubble. As their bubble deflates and they continue to devalue their currency, they will spread deflation throughout the world. Also, because the Fed mismanaged this economic cycle so poorly, they will be "out of bullets" if the Chinese and the emerging markets problems become a global crisis.
Asset Allocation: Valuation and the market's risk-reward drive our asset allocation, which is defensive and positioned to perform well during the slowing economic environment. Recently, our risk management overlay based on volatility, trend and momentum, further reduced our equity exposure.
| Current Asset Allocation: | |||
| Large Cap Equity | 30.0% | Long-term U.S. Gov. Bonds | 16.0% |
| Small Cap Equity | 0.0% | Int-term U.S. Gov. Bonds | 15.0% |
| International Equity | 0.0% | Municipal Bonds | 11.0% |
| Emerging Markets | 0.0% | Gold/Currency | 18.0% |
| Equity Hedge/Volatility | (10.0%) | Commodity | 0.0% |
| RISK ASSETS | 20.0% | SAFE ASSETS | 60.0% |
Equity Market Outlook: We continue to believe that stocks offer an extremely poor risk-reward because six years of excess liquidity provided by the Fed, drove stocks to a historic level of overvaluation. Currently, stocks are significantly overvalued, while corporate profits are declining, and profit margins are regressing to mean from an extremely inflated level. We expect earnings to continue to disappoint as profit margins return to a normal level. Given the weak fourth quarter rally and the sharp sell off to begin the New Year, we believe we are in a bear market. A weekly close below the August low on the S&P 500 (1867) would increase our conviction level. If we are correct, and we are in a bear market, the average decline is 32.4% over 13 months, though we estimate that fair value for the market is 1265 on the S&P 500, down 41%.
Chart 1: Market Capitalization to GDP
In a 2001 Fortune Magazine article, Warren Buffet stated that Market Capitalization relative to GDP "is probably the best single measure of where valuations stand at any given moment." Currently, the stock market capitalization is 120% of GDP; this is significantly above the 50-year average of 65%. Stocks would need to decline by 45% to be considered fairly valued. In fact, most long-term valuation measures -- Tobin Q, Market cap to GDP, Shiller's CAPE, book value, and 12 month trailing P/E -- indicate that the market is fairly valued at 1265 on the S&P 500, a 41% decline from the market's May all-time-high.

Source: FRED
Chart 2: S&P 500 and GAAP Earnings
While the S&P 500 was flat for 2015, GAAP earnings have already fallen 15% from the September of 2014 cyclical peak. In our view, stocks were detached from the fundamentals due to the excess liquidity provided by the Fed. Currently, the Fed is tightening and draining liquidity, so stocks are vulnerable.

Source: StockCharts.com
Chart 3: Corporate Profits to GDP
Over time, profit margins are highly mean reverting. Currently, at 10.1% of GDP, profit margins are nearly two-and-one-half standard deviations above the historic average of 6.5%. We expect earnings growth will continue to disappoint as profitability returns to a normal level. If margins regress to average levels, earnings could fall by 36% (operating EPS of $70).

Source: FRED
Since the last recession, financial assets have been driven by the tremendous liquidity due to the $3 trillion increase in the Fed's balance sheet. In December, the Fed raised rates for the first time in nine years and has indicated they expect to raise rates at least four more times in 2016. Unfortunately, in our view, the Fed waited too long to tighten and final capitulated just as the economy was slowing. Market-based indicators -- credit spreads, the yield curve, inflation expectation, market breadth and gold's twelve-month rate-of-change -- indicate a lack of liquidity in the system and the increasing risk of a significant economic slowdown.
Chart 4: Yield Curve (2-year to 10-year)
A flattening yield curve does not bode well for economic growth. The yield curve has flattened dramatically since its January 2014 high, and has flattened by 50bps over the past six-months to its lowest level since the 2008 recession.

Source: FRED
Chart 5: Investment-Grade Credit Spreads
While the Fed finally raised interest rates by 0.25% in December, Baa investment-grade interest rates have risen 100bps to 5.46%. Credit spreads have also widened by 100bps over the past twelve-months. This sharp increase indicates a change in investors risk tolerance, a reduction in liquidity and will provide a difficult environment for equities.

Source: FRED
Short Term View (three months): Disappointing economic news in the U.S. and China were the catalyst for the sharp decline that began the New Year. As we discussed in our October investment letter:
The quality of the expected Q4 rally will be critical; if the breadth is narrow and the rally is weak, in our view, the odds of a bear market in 2016 would increase significantly.
The fourth quarter rally was very narrow (few companies participated), the volume was disappointing, and importantly, credit spreads and the yield cure continued to deteriorate. Given the weak fourth quarter rally and the sharp decline to begin the year, we believe we are in a bear market that began this past summer. While the S&P 500 performed well until recently, most stocks have been performing poorly since the summer. Narrow market advances, typically lead to severe corrections and bear markets.
Chart 6: S&P 500 and NYSE stocks over their 200-day Moving Average
While the S&P 500 rallied near its all-time-high in the fourth quarter, most stocks remained in a bear market (i.e. below their 200-day moving average). Currently, by this measure, 78% of NYSE stocks are in a bear market.

Source: StockCharts.com
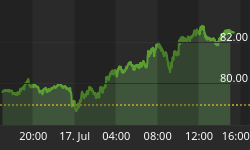
After a 12.8% decline over the three weeks ending January 20th, the equity market was very oversold and due for a rally. Typically, oversold rallies retrace 50%-to-70% of the preceding decline over a period of two-to-three weeks. The current rally has retraced 50% of the previous decline in two weeks, and, in our view, the oversold rally is almost complete. We believe investors should take advantage of this counter-trend rally and reduce their equity exposure.
Chart 7: S&P 500 and 10-day NYSE Advance-Decline Ratio
The market has retraced 50% of its previous decline over the past two weeks. While the rally could advance another 2.0%-to-3.0% over the next week, or so, the 10-day NYSE advance-decline ratio indicates the market is overbought and the rally is nearly complete.

Source: StockCharts.com
Economic Outlook: The U.S. economy grew at a disappointing 0.7% in the fourth quarter, and 1.8% year-over-year for 2015 -- the weakest growth since 2011. Nominal GDP (real GDP plus inflation) grew at 2.9%, a level only seen during recessions.
Chart 8: Nominal GDP
Nominal GDP grew less than 3% for 2015. Historically, this is a level that only occurs during recessions and is another indication of the deflationary pressure in the global economy

Source: FRED
As we have discussed in the past, many strategists and pundits believe that because this economic expansion has been so tepid, we must still be in the early-to-middle stages of the economic expansion. We disagree and believe that the disappointing economic growth is a result of the excessive debt burden accumulated over the past several decades. Historically, shallow economic expansions and severe recessions are typical of debt-burdened economies.
Chart 9: Federal Debt to GDP
Currently, the Federal Debt to GDP is greater than 100%. "This Time is Different: Eight Centuries of Financial Folly", by Carmen Reinhart and Kenneth Rogoff, is the seminal study of debt-driven economic booms and busts. After studying centuries of economic data, they concluded that when government debt exceeds 90% of GDP, median growth rates fall by one percent and average growth falls considerably more. In this context, our tepid growth should not be a surprise.

Source: FRED
The current expansion is 79 months old, and is longer than 29 of the 33 (88%) expansions since 1854. Over the past 55 years, a recession has occurred, on average, every 6.9 years. Since this expansion is nearly seven years old, we believe that the current economic expansion is mature and vulnerable to an external shock.
Unfortunately, during the expansion we did not address our structural issues -- too much debt, too little investment and excessive regulation and taxation. Additionally, because the Fed failed to normalize interest rates during the expansion, we are concerned they are out of monetary tools and any downturn will be severe.
We are also concerned that the deflationary pressure -- evident in the oil and commodity sectors, global interest rates ($6.3 trillion of global government debt yields less than 0%), China and the other emerging market economies -- could push the U.S. and the rest of the world into recession or even a financial crisis.
Aggressive Chinese growth led to a massive credit bubble that now appears to be deflating and negatively impacting global growth and liquidity. Since the 2008 global recession and financial crisis, China was the world's primary growth engine, accounting for an incredible 41% of global GDP growth.
| 2008 | 2014 | Net | |
| Global GDP | $63.1T | $77.4T | +$14T |
| China | $4.5T | $10.4T | +$5.8T (41% of global growth) |
To fund this rapid growth, China borrowed heavily. From 2007 through mid-2014, McKinsey estimates that China's total debt grew from $4.5T (158% of GDP) to $29T (282% of GDP). This historic debt accumulation fueled by lax lending standards led to significant mal-investment and overcapacity. Today, private debt (corporate and consumer) is 200% of Chinese GDP; this is greater than the U.S. preceding the "Great Financial Crisis."
Many pundits expected China to grow its way out of these structural issues. China's economic problems were compounded when the Fed ended QE3 in October of 2014. Once the QE program ended, the dollar rallied by 25% over the next eighteen months. Because China pegged its currency to the U.S. Dollar, the Yuan also rallied, causing Chinese exports to become less competitive and their economy to slow.
Since Chinese exports are now less competitive and they are burdened with too much debt and excess capacity, we expect the Chinese government will continue to devalue the Yuan, in an effort to stimulate demand and increase capacity utilization. Chinese devaluations will continue to drain global liquidity and spread deflationary pressure through the global economy and potentially push the world into another global recession.
Chart 10: The U.S. Dollar
Since the end of QE3 in October of 2014, the dollar has dramatically appreciated, as many of our trading partners engaged in competitive currency devaluations to drive their exports and stimulate their growth. The strength in the dollar is a de facto monetary tightening because it drains liquidity from our economy. China currency was pegged to the dollar and also appreciated greatly, leading to an economic slowdown.

Source: StockCharts.com
Summary:
-
Equities are in a correction, and if the S&P500 closes below its August low (1867) on a weekly basis, it will confirm that we are in a bear market.
-
A bear market in equities, coupled with the weakness in the market-based indicators, presages a significant economic slowdown or recession.
-
Structural issues were not addressed during the nearly seven year economic expansion, and now the U.S. is more vulnerable to a severe economic contraction.
-
The Fed mismanaged this economic cycle and failed to normalize interest rates. We fear they are "out of bullets", if a recession or financial crisis occurs.
-
While the average bear market is 32.4%, we believe fair value for the S&P 500 is 1265 -- 41% below the May all-time high.
After a flat 2015, the equity markets began the year with another sharp decline based on economic uncertainty, a lack of global liquidity and a shift in investor's risk tolerance. Given the technical deterioration that has occurred over the past eight months, coupled with: a flattening yield curve, widening credit spreads, contracting profit margins and declining profits, we believe we are in an equity bear market, which presages a significant economic slowdown or recession.
After six years of excess liquidity, created by central bankers, driving assets prices from their intrinsic value and underlying fundamentals, it now appears that the bull market is over and markets are in the process of regressing to the mean.
While it is too early to know if we are headed for an economic slowdown, recession or even a global crisis, we believe investors should focus on preserving capital, until equities offer a positive risk-reward.
Our core philosophy is that the best way to grow wealth is: have a long-term investment horizon, invest in a value-driven, diversified and economically balanced portfolio and avoid major losses. The bull market is mature, profit margins and earnings are contracting; yet the equity markets remain overvalued and offer a very poor risk-reward. We believe prudent investors should reduce their exposure to risky assets and be patient until the risk-reward improves and investors are adequately rewarded for assuming equity risk. Historically, liquidity-driven bull markets deflate quickly, and patient investors will be rewarded with great values and significant long-term opportunities.
If there are any questions or comments, please don't hesitate to call.
All information disclosed in this statement is accurate and complete to the best of our knowledge. Past performance is no guarantee of future results, and there is no assurance that the firm or client's investment objectives will be achieved.


