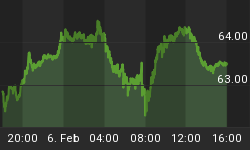
- A potent move with two consecutive gaps and a sort of Three White Soldiers pattern represents a strong reversal. Bulls are launching a counterattack
- Although it is doubtful that corrective down leg from the February 2 high has completed the assumed wave (5) if SP 500 breaches the February peak then we should expect a large countertrend rally (Double Bottom?)
- Since price is now quite extended a pullback is probable. If the range 1895.50 - 1881 holds then odds should favor a break out above the February 2 high
- Hourly RSI is extremely overbought and it is displaying a small negative divergence hence some type of consolidation activity is plausible
- Due to the questionable ending pattern (Expanded Ending Diagonal?) a Triangle is still possible (Now unfolding the wave C) but less likely. If this is the case the first step is a reversal and the loss of the support located in the range 1895 (Today's gap) - 1889 (200 hr. ma)
- Despite the doubts if bulls are able to reclaim the February 2 high then the key price levels (Potential reversal areas) are located at R1 = 1961 (50 dma) - 1963 (0.5 retracement); R2 = 1999 (0.618 retracement); R3 = 2032 (200 dma). The Double Bottom has a measured target at 2084.
- Bulls have on their side that the decline from the May top has unfolded a corrective 3-wave down leg (From the 2009 low a corrective decline has always been followed by the resumption of the uptrend), but with overhead resistance looming and short term indicators at extremes we shall see if buying pressure persist.
- If above 1948 I would be surprised if SP 500 exceeds the 0.618 retracement


