• 758 days Will The ECB Continue To Hike Rates?
  • 758 days Forbes: Aramco Remains Largest Company In The Middle East
  • 760 days Caltech Scientists Succesfully Beam Back Solar Power From Space
  • 1,160 days Could Crypto Overtake Traditional Investment?
  • 1,164 days Americans Still Quitting Jobs At Record Pace
  • 1,166 days FinTech Startups Tapping VC Money for ‘Immigrant Banking’
  • 1,169 days Is The Dollar Too Strong?
  • 1,170 days Big Tech Disappoints Investors on Earnings Calls
  • 1,171 days Fear And Celebration On Twitter as Musk Takes The Reins
  • 1,172 days China Is Quietly Trying To Distance Itself From Russia
  • 1,173 days Tech and Internet Giants’ Earnings In Focus After Netflix’s Stinker
  • 1,177 days Crypto Investors Won Big In 2021
  • 1,177 days The ‘Metaverse’ Economy Could be Worth $13 Trillion By 2030
  • 1,178 days Food Prices Are Skyrocketing As Putin’s War Persists
  • 1,180 days Pentagon Resignations Illustrate Our ‘Commercial’ Defense Dilemma
  • 1,180 days US Banks Shrug off Nearly $15 Billion In Russian Write-Offs
  • 1,184 days Cannabis Stocks in Holding Pattern Despite Positive Momentum
  • 1,184 days Is Musk A Bastion Of Free Speech Or Will His Absolutist Stance Backfire?
  • 1,185 days Two ETFs That Could Hedge Against Extreme Market Volatility
  • 1,187 days Are NFTs About To Take Over Gaming?
How The Ultra-Wealthy Are Using Art To Dodge Taxes

How The Ultra-Wealthy Are Using Art To Dodge Taxes

More freeports open around the…

Zombie Foreclosures On The Rise In The U.S.

Zombie Foreclosures On The Rise In The U.S.

During the quarter there were…

  1. Home
  2. Markets
  3. Other

Elliott Wave Analysis On USDCAD And SP500

USDCAD

On USDCAD we are looking at declining price action from 1.4018 that can be an expanding diagonal, now moving down into the final stages of decline. We see wave 5 of C) headed beneath 1.3650 and even towards 1.3600 area, where pair can be looking to form a low this week.

USDCAD, 1H

USDCAD 1-Hour Chart


S&P500

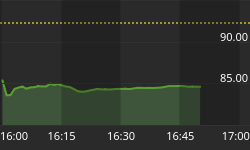
E-mini S&P500 keeps moving up, so we adjusted the wave count which is still an impulse from the low, but now with wave v-circled in progress up to 382.% projection level of wave three measured from end of wave four. At the same time we also see a divergence on the RSI, which is very common between waves three and five that indicates a coming turning point. That said, we still think that sooner or later new set-back will occur in minimum three waves.

S&P500, 1H

S&P500 1-Hour Chart


If you like our trading analysis, you can visit our website at --> www.ew-forecast.com


Back to homepage

Leave a comment

Leave a comment