• 278 days Will The ECB Continue To Hike Rates?
  • 278 days Forbes: Aramco Remains Largest Company In The Middle East
  • 280 days Caltech Scientists Succesfully Beam Back Solar Power From Space
  • 679 days Could Crypto Overtake Traditional Investment?
  • 684 days Americans Still Quitting Jobs At Record Pace
  • 686 days FinTech Startups Tapping VC Money for ‘Immigrant Banking’
  • 689 days Is The Dollar Too Strong?
  • 689 days Big Tech Disappoints Investors on Earnings Calls
  • 690 days Fear And Celebration On Twitter as Musk Takes The Reins
  • 692 days China Is Quietly Trying To Distance Itself From Russia
  • 692 days Tech and Internet Giants’ Earnings In Focus After Netflix’s Stinker
  • 696 days Crypto Investors Won Big In 2021
  • 697 days The ‘Metaverse’ Economy Could be Worth $13 Trillion By 2030
  • 697 days Food Prices Are Skyrocketing As Putin’s War Persists
  • 700 days Pentagon Resignations Illustrate Our ‘Commercial’ Defense Dilemma
  • 700 days US Banks Shrug off Nearly $15 Billion In Russian Write-Offs
  • 703 days Cannabis Stocks in Holding Pattern Despite Positive Momentum
  • 704 days Is Musk A Bastion Of Free Speech Or Will His Absolutist Stance Backfire?
  • 704 days Two ETFs That Could Hedge Against Extreme Market Volatility
  • 706 days Are NFTs About To Take Over Gaming?
Billionaires Are Pushing Art To New Limits

Billionaires Are Pushing Art To New Limits

Welcome to Art Basel: The…

What's Behind The Global EV Sales Slowdown?

What's Behind The Global EV Sales Slowdown?

An economic slowdown in many…

Zombie Foreclosures On The Rise In The U.S.

Zombie Foreclosures On The Rise In The U.S.

During the quarter there were…

  1. Home
  2. Markets
  3. Other

The State of the Trend

A few weeks ago we mentioned that two different cycles, connecting weekly swing highs and lows, converge at the beginning of March. The index price action which followed was a testament to their opposing effect. The 1820 low we were expecting held and the SP500 staged an advance to finish February barely lower than the close on January 30th.

This can be best seen in the monthly chart which, from a trend following point of view, has something to offer to both the pessimist and the optimist.

For those who view the glass as half empty and follow a MACD system tuned to the historical rate of vibration of the index, the trend turned in June '15, and remains negative to this day:

S&P500 Monthly Chart

For those who view the glass as half full, and follow a simple moving average cross-over system, the uptrend remains intact and the index is undergoing a normal correction which won't lead to a trend reversal:

S&P500 Monthly Chart 2

The combined interaction of both strategies can be seen here, and it shows that we remain in the caution zone:

S&P500 Monthly Chart 3

From a swing trading point of view, however, the picture is much less ambiguous, as the SPX is in an upswing in all three time frames (daily, weekly, and monthly).

The monthly SP500 upswing will remain intact as long as the index trades above 1962:

S&P500 Monthly Chart 4

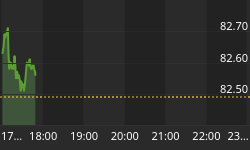
The weekly upswing will remain in effect so long as the SP500 trades above 1910, while for the daily upswing to continue, the index needs to trade above 1950 and the 1 x 1 angle which is currently at the same level:

S&P500 Daily Chart

The last couple of weeks did wonders for bullish sentiment which reached exhaustion levels suggesting that a sideways/down move should begin shortly. This is likely to coincide with the next CIT date of March 7th.

Weekly Sentiment


Back to homepage

Leave a comment

Leave a comment