• 886 days Will The ECB Continue To Hike Rates?
  • 886 days Forbes: Aramco Remains Largest Company In The Middle East
  • 888 days Caltech Scientists Succesfully Beam Back Solar Power From Space
  • 1,287 days Could Crypto Overtake Traditional Investment?
  • 1,292 days Americans Still Quitting Jobs At Record Pace
  • 1,294 days FinTech Startups Tapping VC Money for ‘Immigrant Banking’
  • 1,297 days Is The Dollar Too Strong?
  • 1,297 days Big Tech Disappoints Investors on Earnings Calls
  • 1,298 days Fear And Celebration On Twitter as Musk Takes The Reins
  • 1,300 days China Is Quietly Trying To Distance Itself From Russia
  • 1,300 days Tech and Internet Giants’ Earnings In Focus After Netflix’s Stinker
  • 1,304 days Crypto Investors Won Big In 2021
  • 1,304 days The ‘Metaverse’ Economy Could be Worth $13 Trillion By 2030
  • 1,305 days Food Prices Are Skyrocketing As Putin’s War Persists
  • 1,308 days Pentagon Resignations Illustrate Our ‘Commercial’ Defense Dilemma
  • 1,308 days US Banks Shrug off Nearly $15 Billion In Russian Write-Offs
  • 1,311 days Cannabis Stocks in Holding Pattern Despite Positive Momentum
  • 1,312 days Is Musk A Bastion Of Free Speech Or Will His Absolutist Stance Backfire?
  • 1,312 days Two ETFs That Could Hedge Against Extreme Market Volatility
  • 1,314 days Are NFTs About To Take Over Gaming?
  1. Home
  2. Markets
  3. Other

EURUSD Still In A Triangle

EURUSD has turned up last week after declining down to 1.0830 level since mid of February. Pair closed at 1.1000 on Friday, which suggests that EURUSD found a temporary swing low and that wave D-circled is finished. If that is the case then we can expect more sideways price action to the upside as we will look for a three wave rise in wave E-circled that can retrace even back to the upper trendline before real weakness comes in play, for wave V down.

EURUSD, Daily

EURUSD Daily Elliott Wave Chart

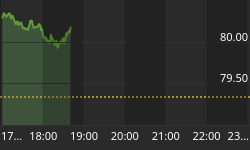
On the lower time frame, EURUSD is turning to the upside after it broke out of a downward channel which is an important indication of a completed decline from 1.1377 high that we labeled it as wave D. Notice that bounce from recent low is quite strong, so we would not be surprised if price will continue higher in days ahead into wave E, final leg of a big triangle which can reach even 1.1100-1.1200 area where we would expect a new but very important bearish turn sometime this month.

EURUSD, 4H

EURUSD 4-Hour Elliott Wave Chart

A Triangle is a common 5 wave pattern labeled A-B-C-D-E that moves counter-trend and is corrective in nature. Triangles move within two channel lines drawn from waves A to C, and from waves B to D. Triangles are overlapping five wave affairs that subdivide into 3-3-3-3-3.

A Basic Triangle Pattern :

Idealized Basic Triangle Pattern


If you like our trading analysis, you can visit our website at --> www.ew-forecast.com


Back to homepage

Leave a comment

Leave a comment