


Market Summary
Gold is now in a bull market. According to CNN News this is a stunning rally because gold has continued to do well even as oil prices and the stock market have stabilized in recent weeks. At the beginning of the year, it was easy to understand why gold was glittering. Investors were extremely nervous about China and the global economy. Those were big reasons why oil and stocks fell. Gold benefited since it's universally regarded as a safe haven fear trade in times of turmoil. It's a hard, tangible asset and not pieces of paper like currencies, stocks and bonds. But investors no longer seem to be paralyzed by fear. The stock market rose for the 4th week in a row, as the Benchmark S&P 500 Index broke through its key 200-day moving average to close out the week. The European Central Bank issued a host of new stimulus and unsurprising rate cuts for deposits. The announcement initially caused roller coaster action for equities, treasuries and currencies, but after investors analyzed the data stocks drove higher to end the week. For the week, the S&P 500 Index advanced 1.1% while the Blue Chip Dow Jones Industrial Average rose 1.2%. The Nasdaq added 0.7% while the small cap Russell 2000 crawled up 0.4% for the week. As confirmed in the chart below, treasury prices are turning down under interest rate pressure and gold stocks are going soaring.

A standard chart that we use to help confirm the overall market trend is the Momentum Factor ETF (MTUM) chart. Momentum Factor ETF is an investment that seeks to track the investment results of an index composed of U.S. large- and mid-capitalization stocks exhibiting relatively higher price momentum. This type of momentum fund is considered a reliable proxy for the general stock market trend. We prefer to use the Heikin-Ashi format to display the Momentum Factor ETF. Heikin-Ashi candlestick charts are designed to filter out volatility in an effort to better capture the true trend. Next week is critical for determining the market trend. The updated graph below indicates stocks are in a trading range. Most market technicians believe the most likely scenario is the MTUM will break out and continue higher in the directions of the current trend.

In the chart below, the Aggregate Bond ETF (AGG) represents the "bond" market and the Equal-Weight S&P 500 ETF (RSP) is the stock market benchmark. The updated chart below shows that investors are selling off bonds and using the proceeds to bid on equities.

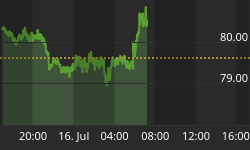
In the chart below gold continues moving sharply higher as the dollar falls and the European Central Bank expands its monetary policies - boosting safe-haven demand. Treasury prices tumbled Friday, pushing yields higher for the fourth straight week -- the longest streak of rising yields since May 2013 -- as a rally in riskier assets, including equities and oil, led investors to sell safe-haven assets.

Market Outlook
Quarterly earnings season is basically done so the focus will be on key economic data due next week. The main event is the FOMC meeting where the Fed is expected to address market stress, global economic weakness, inflation signals and labor market strength. Pundits will be sifting for clues on future rate increases, which will determine if treasury prices stabilize or continue falling. In the updated graph below equities still have a ways to go to gain positive traction since the pullback that began in mid-December, but gold prices are booming.

The CBOE Volatility Index (VIX) is known as the market's "fear gauge" because it tracks the expected volatility priced into short-term S&P 500 Index options. When stocks stumble, the uptick in volatility and the demand for index put options tends to drive up the price of options premiums and sends the VIX higher. VIX has fallen to its lowest level for the year, which is noteworthy as equity markets began the year trading with extended volatility. Recent observations are still appropriate "...the VIX is in a downtrend which coincides with the surge in "risk-on" trading...If investors continue "risk-on" trading expect the Volatility number to keep falling lower...the Volatility Index continues falling to the lowest level since the end of last year. As investors have become more confident in the U.S. economy and near term direction of the stock market, expect the VIX to fall near November lows..."

The American Association of Individual Investors (AAII) Sentiment Survey measures the percentage of individual investors who are bullish, bearish, and neutral on the stock market for the next six months; individuals are polled from the ranks of the AAII membership on a weekly basis. The current survey result is for the week ending 03/09/2016. The most recent AAII survey showed 37.40% are Bullish and 24.40% Bearish, while 38.30% of investors polled have a Neutral outlook for the market for the next six months. Recent comments are playing out as advertised where we stated, "...As a reliable contra-indicator the current AAII survey signals continued follow through on a countertrend bounce... The latest AAII survey signals the current bullish trend has more room to run..." Unless the Fed proffers a negative surprise during their meeting, the stock market should continue grinding higher according to the most recent AAII sentiment survey.

The National Association of Active Investment Managers (NAAIM) Exposure Index represents the average exposure to US Equity markets reported by NAAIM members. The blue bars depict a two-week moving average of the NAAIM managers' responses. As the name indicates, the NAAIM Exposure Index provides insight into the actual adjustments active risk managers have made to client accounts over the past two weeks. The current survey result is for the week ending 03/09/2016. Fourth-quarter NAAIM exposure index averaged 44.61%. Last week the NAAIM exposure index was 54.44%, and the current week's exposure is 51.01%. Professional traders are probably on hold as they await the results of next week's FMOC meeting. If they like what they hear from the Fed we expect the NAAIM Exposure Index to go higher.

Trading Strategy
As reported in the Stock Trader's Almanac, stock options, index options, index futures, and single-stock/ETF futures all expire at the same time four times each year, March, June, September and December. This event is often referred to as Quadruple Witching or as we prefer to call it Triple Witching. March's option expiration week performance is second only to December's and has a bullish bias. DJIA and S&P 500 have recorded weekly gains in roughly twice the number of weeks as there have been declines. NASDAQ's track record since 1983 is slightly softer with 20 advances and 13 declines. However, the week after tends to be bearish for DJIA and S&P 500. NASDAQ is mixed. The updated graph below indicates last week's comments are still in play where we said "...all systems are on go as all the major S&P sectors are positive over the past 30 days. As recession talk subsides and potential Fed rate increases fall off the table investors are increasingly willing to take on more risk. In the graph below the best performing sectors are considered the highest risk equity classes. We are currently in the middle of what is considered the "best six months of the year" for the stock market. We like undervalued or oversold shares to bid on because the current bullish trend has more room to run..."

Feel free to contact me with questions,


