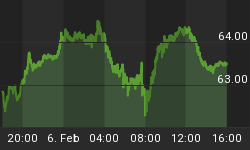
The price correlation between the Crude and equity Cycles was on full display last week. The only real difference is the relentless nature of Crude's surge higher. Crude was so oversold and bearish sentiment so elevated, that its march higher from the Investor Cycle Low has been unyielding.
The action appears to be a classic bear market squeeze, as traders who bet big on a continued decline have been forced to cover their Shorts. And in the process, Crude's mood has quickly turned. The mood was bleak and extremely bearish just a month ago, but we've now begun to hear opinions that the bear market has ended and that Crude has seen the bottom.
Don't believe it. In my opinion, the current bear market is still in its early stages, and the current move higher is just a sentiment-clearing event. I will concede, however, that the move higher is strong enough that it is likely to continue for some weeks. I am targeting early April for a top. In the shorter term, however, there is the potential for a Daily Cycle Low (DCL), one that will shake the confidence of the bulls.

The size and speed of the rally in energy producers - over 30% in a few weeks - confirms that a new Investor Cycle (IC) is underway. As a result of the move, the percentage of energy sector stocks showing a bullish P&F (BPENER) chart has hit a record 95%, matching levels not seen in many years, if ever. The BPENER level is a testament to the extreme nature of the recent rally, and provides a reason to be cautious now.
In the past, every Crude IC top has corresponded with a BPENER level of over 80%. It's well over that now, but since it appears that the current rally has serious speculative power behind it, I believe that the current elevated reading is likely to persist for some weeks. Still, the level of the indicator suggests that Crude Oil has entered the topping area of the IC, and it is unlikely that the current IC can continue more that 3-4 weeks higher.

The weekly and monthly charts always allow us to better understand short-term action. They also provide needed perspective to day and swing traders, who can form powerful and unfounded biases from their observations of short-term moves.
This recent Crude rally has been both powerful and convincing, but we must appreciate that it is only a short-term rally. On the weekly timeframe, it is an inconsequential blip in a much larger and more enduring bear market decline. Just 4 weeks removed from a 17-year low, Crude has given us only a mean-reversion rally so far.

The Financial Tap publishes two member reports per week, a weekly premium report and a midweek market update report. The reports cover the movements and trading opportunities of the Gold, S&P, Oil, $USD, US Bond's, and Natural Gas Cycles. Along with these reports, members enjoy access to two different portfolios and trade alerts. Both portfolios trade on varying time-frames (from days, weeks, to months), there is a portfolio to suit all member preferences.
You're just 1 minute away from profitable trades! please visit: http://thefinancialtap.com


