• 857 days Will The ECB Continue To Hike Rates?
  • 857 days Forbes: Aramco Remains Largest Company In The Middle East
  • 859 days Caltech Scientists Succesfully Beam Back Solar Power From Space
  • 1,259 days Could Crypto Overtake Traditional Investment?
  • 1,264 days Americans Still Quitting Jobs At Record Pace
  • 1,265 days FinTech Startups Tapping VC Money for ‘Immigrant Banking’
  • 1,269 days Is The Dollar Too Strong?
  • 1,269 days Big Tech Disappoints Investors on Earnings Calls
  • 1,270 days Fear And Celebration On Twitter as Musk Takes The Reins
  • 1,271 days China Is Quietly Trying To Distance Itself From Russia
  • 1,272 days Tech and Internet Giants’ Earnings In Focus After Netflix’s Stinker
  • 1,276 days Crypto Investors Won Big In 2021
  • 1,276 days The ‘Metaverse’ Economy Could be Worth $13 Trillion By 2030
  • 1,277 days Food Prices Are Skyrocketing As Putin’s War Persists
  • 1,279 days Pentagon Resignations Illustrate Our ‘Commercial’ Defense Dilemma
  • 1,279 days US Banks Shrug off Nearly $15 Billion In Russian Write-Offs
  • 1,283 days Cannabis Stocks in Holding Pattern Despite Positive Momentum
  • 1,284 days Is Musk A Bastion Of Free Speech Or Will His Absolutist Stance Backfire?
  • 1,284 days Two ETFs That Could Hedge Against Extreme Market Volatility
  • 1,286 days Are NFTs About To Take Over Gaming?
What's Behind The Global EV Sales Slowdown?

What's Behind The Global EV Sales Slowdown?

An economic slowdown in many…

How The Ultra-Wealthy Are Using Art To Dodge Taxes

How The Ultra-Wealthy Are Using Art To Dodge Taxes

More freeports open around the…

  1. Home
  2. Markets
  3. Other

Elliott Wave Analysis On 10 Year US Notes And SP500

Chart of the 10 year US notes shall be the most important for now as price action is quite clear and suggests that wave (C) is due. We expect another leg up to around 130.50 area, so in the mean time yields will be lower which can keep stock market under pressure.


10 Year US Notes, 4H

US 10-Year Note 4-Hour Chart

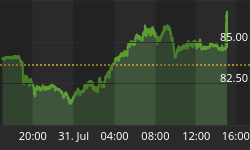
In fact, the price personality of the last few days on the E-mini S&P500 also suggests that current uptrend is tired and that correction is coming. We are looking at completed ending diagonal that can send price down into an A-B-C set-back.


S&P500, 1H

S&P500 1-Hour Chart


If you like our trading analysis, you can visit our website at --> www.ew-forecast.com


Back to homepage

Leave a comment

Leave a comment