


Weekly time frame:
- SP 500 ended the week with a Harami candlestick. Price has been rejected at the trend line that connects the November and December lower highs and the 0.786 retracement of the previous down leg.
- In an extended up trend a Harami can mark a top.
- If a s/t top is in place next week bears have to breach the 50 wma = 2031 and the support located at 2021
- If this is the case the 20 wma = 1989 would come into play.
- In the weekly time frame below the 20 wma there is a "pocket of air" until the neckline of the Double Bottom at 1947.
- In my humble opinion if a pullback is underway it will establish a higher low and the next up leg will aim at the measured target of the Double Bottom at 2085. At the moment a return to the February low is unlikely

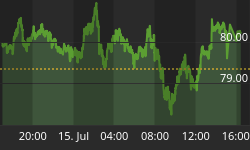
- The rising 10 dma of the Equity Put/Call ratio is not supportive the scenario of a major top.

Daily time frame:
- On Friday SP 500 gapped down and breached the trend line of a potential Rising Wedge, although the gap has not been closed the hammer candlestick could deter the kickoff of a pullback if next week bulls reclaim the broken trend line.
- If bulls fail and a pullback is underway bears have two huge obstacles to overcome the 200 dma = 2017 and the 20 dma = 2007
- If as seen in the weekly time frame the 20 wma is going to come into play a shallow pullback could bottom at the gap fill = 1989.57
- Below the gap fill we have a S1 at 1969 and S2 at 1947

- Daily Oscillators are suggesting that a pullback is a probable scenario provided next week the MACD triggers a bearish signal cross. In the mean time the RSI(14) has breached the trend line from the February low.

60 minute time frame:
- The broken Rising Wedge is a compelling reason to expect a retracement in the days ahead provided the 50 hma = 2041 is not reclaimed
- If bears gain this battle there is "white space" until S1 = 2005 (+/- the 20 dma)
- Below S1 we have the target box of a shallow pullback which is delimited by the 200 hma = 1990 (It coincides with the 20 wma and a gap fill in the daily time frame) and the S2=1969

Breadth, which has been exceptionally strong, is showing some deterioration, which should allow a pullback
- The McClellan Oscillator since the beginning of March has been diverging from price (Negative Divergence). On Friday it went negative. If next Week it remains negative it would be aligned with the scenario of a pullback


