• 407 days Will The ECB Continue To Hike Rates?
  • 408 days Forbes: Aramco Remains Largest Company In The Middle East
  • 409 days Caltech Scientists Succesfully Beam Back Solar Power From Space
  • 809 days Could Crypto Overtake Traditional Investment?
  • 814 days Americans Still Quitting Jobs At Record Pace
  • 816 days FinTech Startups Tapping VC Money for ‘Immigrant Banking’
  • 819 days Is The Dollar Too Strong?
  • 819 days Big Tech Disappoints Investors on Earnings Calls
  • 820 days Fear And Celebration On Twitter as Musk Takes The Reins
  • 822 days China Is Quietly Trying To Distance Itself From Russia
  • 822 days Tech and Internet Giants’ Earnings In Focus After Netflix’s Stinker
  • 826 days Crypto Investors Won Big In 2021
  • 826 days The ‘Metaverse’ Economy Could be Worth $13 Trillion By 2030
  • 827 days Food Prices Are Skyrocketing As Putin’s War Persists
  • 829 days Pentagon Resignations Illustrate Our ‘Commercial’ Defense Dilemma
  • 830 days US Banks Shrug off Nearly $15 Billion In Russian Write-Offs
  • 833 days Cannabis Stocks in Holding Pattern Despite Positive Momentum
  • 834 days Is Musk A Bastion Of Free Speech Or Will His Absolutist Stance Backfire?
  • 834 days Two ETFs That Could Hedge Against Extreme Market Volatility
  • 836 days Are NFTs About To Take Over Gaming?
What's Behind The Global EV Sales Slowdown?

What's Behind The Global EV Sales Slowdown?

An economic slowdown in many…

Is The Bull Market On Its Last Legs?

Is The Bull Market On Its Last Legs?

This aging bull market may…

  1. Home
  2. Markets
  3. Other

Elliott Wave Analysis On GOLD And SP500

GOLD

Gold can already be in a corrective set-back it seems after recent push below the wave 4 swing low which looks like a wave A as part of a three wave set-back. We are tracking wave 2) now that can retrace even back to 1220-1225 area where we would expect a bounce later this week. Invalidation level is at 1208; as long this one is in we will look higher.

GOLD, 1H

Gold 1-Hour Chart

S&P500

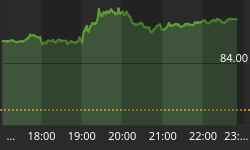
E-mini S&P500 is trading sharply higher making move from 2018 extended so it can be wave iii as well as part of an impulsive trend. However, we see price at 161.8% Fibonacci extension so we may see some short-term pullback for sure with 3-waves.

S&P500, 1H

S&P500 1-Hour Chart


If you like our trading analysis, you can visit our website at --> www.ew-forecast.com


Back to homepage

Leave a comment

Leave a comment