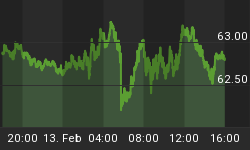
US equity futures and European indexes were pretty strong in first hours of trading in Europe. Nevertheless, the equity market came under some selling pressure later in the session and we got the first signs of weakness in current up leg, mainly in US.
Europe:
We can clearly identify a 5 waves pattern from point 'b?'. So, if the Sigma Whole Europe Index declines below its (red) horizontal support in coming days, the European equity market will be at risk of a major pullback.

It is also important to notice that the Sigma Trend Index Europe is at '45', well above the key '34' level (section 'Quant Model Europe' -> 'Daily - Mean reversal'). So, if we get an impulsive decline in the next 3 sessions, this will generate a sell signal in our daily quant model.
USA:
We can also identify 5 sub-waves in current from point '4?'. On top of that, as the Sigma Whole US Index printed a 'doji' on Tuesday, this means that current up leg could be over. An impulsive decline in coming session would increase the probability of this scenario.

Conclusion:
The equity market gives some signs of weakness, mainly in US. We continue to believe the best trade at this time (on risk/return basis) is short NDX (Nasdaq100).
For those of you interested in our analysis, quant models and trades, you can visit our website (www.sigma-invest.com) for a 'free tour'. You can also subscribe to a 30days free trial (full access). You can also subscribe to our twitter account (@SigmaTradingOsc), it is free and you are updated on our latest view/trades.


