


The good news is:
• The secondaries have been outperforming the blue chips and the number of new lows has been insignificant.
The Negatives
There are not any serious negatives.
On the NYSE new lows have been in single digits, a little higher on the NASDAQ, but nothing worrisome.
The NASDAQ composite (OTC) was down a little last week, but the Russell 2000 small cap index was the strongest of what I consider the major indices.
New highs have come up a little short, but relatively are the strongest we have seen in a while.
The positives
While new highs have been disappointing, new lows have disappeared and nothing really bad will happen without a significant increase in new lows.
The chart below covers the past 6 months showing the OTC in blue and a 40% trend (4 day EMA) of NASDAQ new highs divided by new highs + new lows (OTC HL Ratio), in red. Dashed horizontal lines have been drawn at 10% levels for the indicator, the line is solid at the 50%, neutral level.
OTC HL Ratio declined slightly but remains very strong at 71%.

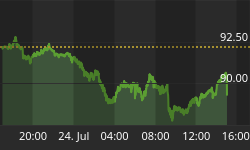
The next chart below is similar to the one above except it shows the S&P 500 (SPX) in red and NY HL Ratio, in blue, has been calculated from NYSE data.
NY HL Ratio finished the week at a sensational 92%.

Seasonality
Next week includes the last 5 trading days of April during the 4th year of the Presidential Cycle.
OTC data covers the period from 1963 to 2015 while SPX data runs from 1928 to 2015. There are summaries for both the 4th year of the Presidential Cycle and all years combined.
In these tables the OTC has been stronger than the SPX. The opposite is what we have been observing.
Report for the last 5 days of April.
The number following the year represents its position in the Presidential Cycle.
The number following the daily return represents the day of the week;
1 = Monday, 2 = Tuesday etc.
| OTC Presidential Year 4 | ||||||
| Day5 | Day4 | Day3 | Day2 | Day1 | Totals | |
| 1964-4 | -0.20% 5 | -1.17% 1 | -0.03% 2 | 0.57% 3 | -0.49% 4 | -1.32% |
| 1968-4 | 0.25% 3 | 0.95% 4 | 1.87% 5 | 0.30% 1 | 0.30% 2 | 3.68% |
| 1972-4 | -0.83% 1 | -0.80% 2 | 0.06% 3 | 0.07% 4 | 0.24% 5 | -1.26% |
| 1976-4 | -0.03% 1 | -0.65% 2 | 0.36% 3 | 0.28% 4 | -0.52% 5 | -0.57% |
| 1980-4 | 1.29% 4 | -0.56% 5 | 0.45% 1 | 0.58% 2 | 0.46% 3 | 2.23% |
| 1984-4 | 0.05% 2 | -0.07% 3 | 0.83% 4 | 0.39% 5 | 0.22% 1 | 1.43% |
| 1988-4 | 0.33% 1 | 0.68% 2 | 0.22% 3 | 0.03% 4 | 0.12% 5 | 1.38% |
| 1992-4 | -0.55% 5 | -1.04% 1 | -1.17% 2 | 1.72% 3 | 1.53% 4 | 0.50% |
| Avg | 0.22% | -0.33% | 0.14% | 0.60% | 0.36% | 0.99% |
| 1996-4 | 0.86% 3 | 0.63% 4 | 0.23% 5 | 0.11% 1 | 0.19% 2 | 2.02% |
| 2000-4 | -4.43% 1 | 6.57% 2 | -2.19% 3 | 3.96% 4 | 2.30% 5 | 6.21% |
| 2004-4 | -0.63% 1 | -0.21% 2 | -2.12% 3 | -1.55% 4 | -1.97% 5 | -6.48% |
| 2008-4 | 0.99% 4 | -0.25% 5 | 0.06% 1 | 0.07% 2 | -0.55% 3 | 0.32% |
| 2012-4 | -0.30% 2 | 2.30% 3 | 0.69% 4 | 0.61% 5 | -0.74% 1 | 2.56% |
| Avg | -0.70% | 1.81% | -0.66% | 0.64% | -0.15% | 0.93% |
| OTC summary for Presidential Year 4 1964 - 2012 | ||||||
| Averages | -0.25% | 0.49% | -0.06% | 0.55% | 0.08% | 0.82% |
| % Winners | 46% | 38% | 69% | 92% | 62% | 69% |
| MDD 4/30/2004 6.32% -- 4/24/2000 4.43% -- 4/28/1992 2.73% | ||||||
| OTC summary for all years 1963 - 2015 | ||||||
| Averages | -0.10% | -0.02% | 0.00% | 0.20% | 0.20% | 0.27% |
| % Winners | 57% | 47% | 68% | 66% | 66% | 58% |
| MDD 4/29/1970 7.72% -- 4/30/2004 6.32% -- 4/29/1999 4.66% | ||||||
| SPX Presidential Year 4 | ||||||
| Day5 | Day4 | Day3 | Day2 | Day1 | Totals | |
| 1928-4 | 0.42% 3 | 0.72% 4 | 1.08% 5 | 0.36% 6 | 0.00% 1 | 2.57% |
| 1932-4 | 1.49% 2 | 2.45% 3 | -3.83% 4 | -3.32% 5 | 0.00% 6 | -3.20% |
| 1936-4 | 0.55% 6 | -3.86% 1 | -0.14% 2 | -2.94% 3 | 1.77% 4 | -4.61% |
| 1940-4 | 0.08% 4 | -0.90% 5 | 0.08% 6 | 0.25% 1 | 0.58% 2 | 0.09% |
| 1944-4 | 0.17% 2 | 0.60% 3 | 0.43% 4 | 0.51% 5 | 0.00% 6 | 1.70% |
| 1948-4 | -1.40% 1 | 0.06% 2 | 0.13% 3 | -0.32% 4 | -0.26% 5 | -1.78% |
| 1952-4 | 0.47% 5 | 0.17% 6 | -0.13% 1 | -0.25% 2 | -0.72% 3 | -0.47% |
| Avg | -0.02% | -0.79% | 0.07% | -0.55% | 0.27% | -1.01% |
| 1956-4 | -0.82% 2 | -0.36% 3 | 0.85% 4 | 1.05% 5 | 0.81% 1 | 1.54% |
| 1960-4 | -1.01% 1 | 0.33% 2 | 0.00% 3 | -0.87% 4 | -0.35% 5 | -1.90% |
| 1964-4 | -0.78% 5 | -0.50% 1 | 0.69% 2 | -0.25% 3 | -0.30% 4 | -1.14% |
| 1968-4 | 0.15% 3 | 0.31% 4 | 0.30% 5 | 0.26% 1 | 0.13% 2 | 1.15% |
| 1972-4 | -0.64% 1 | -0.99% 2 | -0.21% 3 | 0.15% 4 | 0.58% 5 | -1.12% |
| Avg | -0.62% | -0.24% | 0.33% | 0.07% | 0.18% | -0.30% |
| 1976-4 | 0.14% 1 | -0.56% 2 | 0.27% 3 | 0.00% 4 | -0.48% 5 | -0.63% |
| 1980-4 | 0.65% 4 | 0.73% 5 | 0.46% 1 | 0.21% 2 | 0.41% 3 | 2.44% |
| 1984-4 | 0.81% 2 | 0.37% 3 | 1.04% 4 | -0.26% 5 | 0.10% 1 | 2.06% |
| 1988-4 | 0.89% 1 | 0.56% 2 | -0.05% 3 | -0.45% 4 | -0.49% 5 | 0.46% |
| 1992-4 | -0.63% 5 | -0.14% 1 | 0.16% 2 | 0.71% 3 | 0.71% 4 | 0.82% |
| Avg | 0.37% | 0.19% | 0.38% | 0.04% | 0.05% | 1.03% |
| 1996-4 | -0.22% 3 | 0.42% 4 | 0.09% 5 | 0.11% 1 | 0.00% 2 | 0.40% |
| 2000-4 | -0.32% 1 | 3.30% 2 | -1.09% 3 | 0.27% 4 | -0.85% 5 | 1.30% |
| 2004-4 | -0.44% 1 | 0.23% 2 | -1.38% 3 | -0.76% 4 | -0.59% 5 | -2.95% |
| 2008-4 | 0.64% 4 | 0.65% 5 | -0.11% 1 | -0.39% 2 | -0.38% 3 | 0.42% |
| 2012-4 | 0.37% 2 | 1.36% 3 | 0.67% 4 | 0.24% 5 | -0.39% 1 | 2.25% |
| Avg | 0.01% | 1.19% | -0.36% | -0.11% | -0.44% | 0.28% |
| SPX summary for Presidential Year 4 1928 - 2012 | ||||||
| Averages | 0.03% | 0.23% | -0.03% | -0.26% | 0.01% | -0.03% |
| % Winners | 59% | 68% | 59% | 50% | 36% | 59% |
| MDD 4/29/1932 7.02% -- 4/29/1936 6.82% -- 4/30/2004 2.92% | ||||||
| SPX summary for all years 1928 - 2015 | ||||||
| Averages | -0.19% | 0.05% | -0.09% | -0.01% | 0.25% | 0.00% |
| % Winners | 49% | 57% | 52% | 51% | 59% | 57% |
| MDD 4/29/1932 7.02% -- 4/29/1936 6.82% -- 4/29/1931 6.02% | ||||||
Conclusion
The shortage of new highs tells us this is not a strong market. The shortage of new lows tells us there is little to worry about.
I expect the major averages to be higher on Friday April 29 than they were on Friday April 22.
Last week the OTC was down slightly while all of the other major indices were up slightly so I am calling last weeks positive forecast a tie. This is the first time this year the indices have been split. The latest I can remember.
This report is free to anyone who wants it, so please tell your friends. They can sign up at: http://www.stockmarket-ta.com/signup.html. If it is not for you, reply with REMOVE in the subject line.
These reports are archived at: http://www.safehaven.com/
Bruce Stratton who announced his retirement as webmaster of Safehaven.com has found someone interested in taking over the day to day operations of the web site. I am happy to hear that. Safehaven has been carrying and archiving these reports since the early days.
Good Luck,
YTD W 8 / L 7 / T 1


