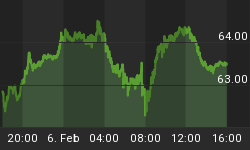
The equity market remains under selling pressure even if we can't really talk about a down trend. Equity investors remain nervous and the equity market remains at risk of a sharp pullback.
Valuation:
Following the sharp selloff in Europe at the beginning of 2016, the European valuation score improved from '3' (neutral) to '4' (attractive).
In the USA, the Sigma valuation score improved from '2' (unattractive) to '3' (neutral) in early February but, following recent up leg in the US equity market, the Sigma valuation score moved back to '2' (unattractive).


Sentiment:
The market sentiment remains highly 'abnormal' at this time. While we have a 'bull bear spread' moderately negative (so, the percentage of bulls is slightly below the percentage of bears), we can notice the 'neutral' sentiment is close to 50% (pink curve). This high level of uncertainty is unsustainable and will probably lead to a sharp rise in volatility. Unfortunately, when volatility raises equity market usually declines.

Technical analysis:
The number of stocks trading above their 20 weeks moving average (grey curve) is close to its 5 years highs. This situation usually occurs at the end of an up cycle: you can notice on the first chart that current level is rather unsustainable on the medium term. So, we expect that current correction could last several weeks.
On the second chart, you can notice that the number of stocks printing 2 years highs (green curve) is going slightly up while the number of stocks printing 2 years lows (red curve) is also going up. This means investors continue to sell some under performing stocks.


The European technical score remains at '2' (unattractive) while the US technical score remains at '3' (neutral).


Looking at both the Sigma Whole Europe Index and the Sigma Whole US Index, we can clearly identify a 5 waves pattern in recent decline. We label this decline as wave "a or 1". Then, we can notice a 'abc' bounce back called wave 'b or 2'. We believe next week will be characterized by a 'c or 3rd' wave to the downside.


Conclusion:
Following the consolidation at the beginning of last week, we consider the equity market is now ready to resume its down trend. We believe next week will be a difficult one (for long investors). If/when this downtrend materializes, we will be able to determine if it is a 'c' wave or a 3rd wave based on its impulsivity.
For those of you interested in our analysis, quant models and trades, you can visit our website (www.sigma-invest.com) for a 'free tour'. You can also subscribe to a 30days free trial (full access). You can also subscribe to our twitter account (@SigmaTradingOsc), it is free and you are updated on our latest view/trades.


