


Forecast from my last public 5/4 blog post: "The inverted cycle has a 5/4 Low, bounce for 1 day 5/5H and it does have another retest higher Low at 5/6-9L, but as this is a Time cycle that 5/6-9L could be a possible lower Low."

Forecast from the 5/5 (2 weeks ago) Raj T&C Daily Email: "The dominant inverted turned straight cycle has 5/4 Low, bounce for a day into 5/5H, followed by a 5/6-9 retest higher or lower Low ("A" on chart), we then rally into 5/11-12 High ("B" on chart) at the 5/11 Solar and 5/12 Geo CIT and then see a volatile (Up and down) decline into 5/20 Low ("C" on chart)"

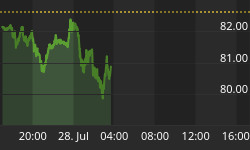
Actual: From the projected 4/20H and 4/28 Highs (see previous posts), we declined 71.60 SP's and 51.48 SP's to a 5/6 swing Low, with first a 5/4 Low, bounce for a day and then the 5/6 swing A wave Low, we then rallied a sharp 45.42 SP's to a 5/10 High at the 5/11 Solar time CIT in a B wave High and have seen a volatile 50.38 SP decline into 5/19 Low so far in a C wave.
The Dominant cycle

The above forecasts were based on the dominant cycle (click on chart to enlarge), which is a historical cycle that predicts future Highs and Lows, within 1-2 days accuracy. The dominant cycle has been in the markets many months now, since the 2/11/16 major Low and so far saw 11 direct "hits" and 1 miss (arrows on chart): 2/11L, 2/24L, 3/4H, 3/11L(-1), 3/17H (miss), 3/28L(-1), 3/31H(+1), 4/12L, 4/22H (-2), 4/27H, 5/4L, 5/6L, 5/11-12H (-1).
What's Next: The dominant cycle is looking for a 5/19-20 swing Low and then projects a rally phase into the next cycle High. It has a market map laid out for the next couple of weeks and months.
Notes: This will be our last public blog post for some time. If you don't want miss our free updates you may follow us on twitter at: https://twitter.com/TimeandCycles or sign up via "Follow by email" (on the right side) at http://timeandcycles.blogspot.com/


