


EURGBP
EURGBP almost completed 5 waves up from the lows. We should start soon an ABC pullback to 0.7704 levels in blue wave 2. We expect to see a nice push into wave 3, after wave 2 low is formed.
EURGB, 4H

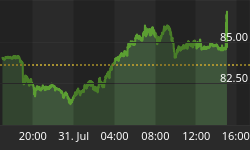
10 Year US Notes
10 year US notes tured higher but only in the ABC corrective pullback. We expect stock market and the USDJPY to turn higher when we see potential highs for wave C around 132 levels since these are correlated. As long as price trades beneath the 133 level- we are looking to the downside.
10 Year US Notes, 4H

Interested in our services ? We have a Special Offer : Get First 2 Months For The Price Of 1!! Grab the opportunity now at www.ew-forecast.com


