• 1,007 days Will The ECB Continue To Hike Rates?
  • 1,008 days Forbes: Aramco Remains Largest Company In The Middle East
  • 1,009 days Caltech Scientists Succesfully Beam Back Solar Power From Space
  • 1,409 days Could Crypto Overtake Traditional Investment?
  • 1,414 days Americans Still Quitting Jobs At Record Pace
  • 1,416 days FinTech Startups Tapping VC Money for ‘Immigrant Banking’
  • 1,419 days Is The Dollar Too Strong?
  • 1,419 days Big Tech Disappoints Investors on Earnings Calls
  • 1,420 days Fear And Celebration On Twitter as Musk Takes The Reins
  • 1,422 days China Is Quietly Trying To Distance Itself From Russia
  • 1,422 days Tech and Internet Giants’ Earnings In Focus After Netflix’s Stinker
  • 1,426 days Crypto Investors Won Big In 2021
  • 1,426 days The ‘Metaverse’ Economy Could be Worth $13 Trillion By 2030
  • 1,427 days Food Prices Are Skyrocketing As Putin’s War Persists
  • 1,429 days Pentagon Resignations Illustrate Our ‘Commercial’ Defense Dilemma
  • 1,430 days US Banks Shrug off Nearly $15 Billion In Russian Write-Offs
  • 1,433 days Cannabis Stocks in Holding Pattern Despite Positive Momentum
  • 1,434 days Is Musk A Bastion Of Free Speech Or Will His Absolutist Stance Backfire?
  • 1,434 days Two ETFs That Could Hedge Against Extreme Market Volatility
  • 1,436 days Are NFTs About To Take Over Gaming?
Another Retail Giant Bites The Dust

Another Retail Giant Bites The Dust

Forever 21 filed for Chapter…

Trade In Counterfeit Goods Hits Half A Trillion Dollars

Trade In Counterfeit Goods Hits Half A Trillion Dollars

The counterfeit market has breached…

  1. Home
  2. Markets
  3. Other

Elliott Wave Analysis On SP500 And USDCHF

S&P500

S&P500 broke out of the fourth wave triangle towards the final wave 5 and is now in attempt to reach lower levels from new highs. We know that after every five wave impluse a three wave correction follows, so now we expect lower levels as in waves A-B and C. Support for this corrective retracement can be around 2071/2075, where previous swings can react as turning points higher.

Invalidation level is at 2040, as long as it hold we are looking to the upside.

S&P500, 30Min

S&P500 30-Minute Chart


USDCHF

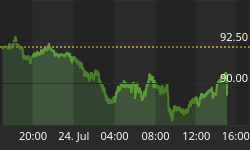
On the USDCHF in the last wave C), price reached our projected levels around 0.951 region, from where a new intraday bounce occured. Because we think that last wave C) is an ending diagonal, a powerfull reversal pattern, we believe that price can now reach higher levels. First indicator for higher levels will be breake above the 0.960 mark.

USDCHF, 1H

USD/CHF 1-Hour Chart


Interested in our services ? We have a Special Offer : Get First 2 Months For The Price Of 1!! Grab the opportunity now at www.ew-forecast.com


Back to homepage

Leave a comment

Leave a comment