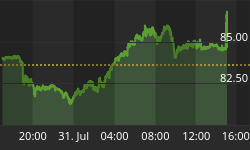
• 320 days Could Crypto Overtake Traditional Investment?
  • 325 days Americans Still Quitting Jobs At Record Pace
  • 327 days FinTech Startups Tapping VC Money for ‘Immigrant Banking’
  • 330 days Is The Dollar Too Strong?
  • 330 days Big Tech Disappoints Investors on Earnings Calls
  • 331 days Fear And Celebration On Twitter as Musk Takes The Reins
  • 333 days China Is Quietly Trying To Distance Itself From Russia
  • 333 days Tech and Internet Giants’ Earnings In Focus After Netflix’s Stinker
  • 337 days Crypto Investors Won Big In 2021
  • 337 days The ‘Metaverse’ Economy Could be Worth $13 Trillion By 2030
  • 338 days Food Prices Are Skyrocketing As Putin’s War Persists
  • 340 days Pentagon Resignations Illustrate Our ‘Commercial’ Defense Dilemma
  • 341 days US Banks Shrug off Nearly $15 Billion In Russian Write-Offs
  • 344 days Cannabis Stocks in Holding Pattern Despite Positive Momentum
  • 345 days Is Musk A Bastion Of Free Speech Or Will His Absolutist Stance Backfire?
  • 345 days Two ETFs That Could Hedge Against Extreme Market Volatility
  • 347 days Are NFTs About To Take Over Gaming?
  • 348 days Europe’s Economy Is On The Brink As Putin’s War Escalates
  • 351 days What’s Causing Inflation In The United States?
  • 352 days Intel Joins Russian Exodus as Chip Shortage Digs In
Strong U.S. Dollar Weighs On Blue Chip Earnings

Strong U.S. Dollar Weighs On Blue Chip Earnings

Earnings season is well underway,…

Billionaires Are Pushing Art To New Limits

Billionaires Are Pushing Art To New Limits

Welcome to Art Basel: The…

How The Ultra-Wealthy Are Using Art To Dodge Taxes

How The Ultra-Wealthy Are Using Art To Dodge Taxes

More freeports open around the…

  1. Home
  2. Markets
  3. Other

Elliott Wave Analysis On Crude OIL And USDCAD

Crude OIL

OIL breaking above the channel resistance line after reaching the 48.11 area of support and completing the complex corrective pullback. This is a good sign for a future upside outlook. We would like to see an impulse wave to develope on the smaller time frames, so we could then be sure that price is going to get higher.

Crude OIL, 1H

Crude Oil 1-Hour Chart


USDCAD

According to this count we are now in the red wave C down with potential resistance around 1.2780 zone, from where a new leg towards wave D) may unfold. This triangle is a bullish one and represents a blue wave B which means we believe that higher levels may be coming as soon the triangle is completed.

Break beneath 1.2655 would invalidate the count.

USDCAD, 1H

USD/CAD 1-Hour Chart


Interested in our services? We have a Special Offer: Get First 2 Months For The Price Of 1!! Grab the opportunity now at www.ew-forecast.com


Back to homepage

Leave a comment

Leave a comment