


The good news is:
• All of the major indices closed within 1% of multi year highs onFriday. By itself, that defines a bull market.
Short term
The NASDAQ composite (OTC) declined 1.3% early last week before closing at a new high on Friday.
The NASDAQ new low indicator (OTC NL) is a 10% trend (19 day EMA) of NASDAQ new lows plotted on an inverted Y axis. When new lows are increasing the indicator moves downward on the screen and when they are decreasing the indicator moves upward on the screen - up is good.
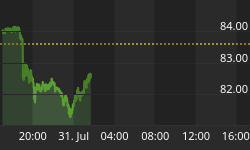
The chart below shows the OTC in red and OTC NL in blue. It covers the period from mid July to last Friday and vertical dashed lines are drawn on the 1st trading day of each month.
During the dip in the early part of last week new lows remained low enough to keep the indicator moving upward.

Intermediate term
Summation indices (SI) are running totals of oscillator values. The chart below shows the OTC in red, OTC AD SI calculated from NASDAQ advancing issues - declining issues, OTC HL SI calculated from NASDAQ new highs - new lows and OTC UD SI calculated from NASDAQ upside - downside volume. The direction of SI's make good intermediate term indicators as of Friday they were all moving upward.

The small caps usually lead both up and down. The chart below shows Accutrack (AT) (a FastTrack relative strength indicator) in black comparing the Russell 2000 (R2K) and the S&P 500 (SPX) in black along with the Wilshire 5000 (WIL-5) in red. The chart covers the period from mid April through last Friday. During the previous cycle (early May to mid October) AT rose pretty steadily from its low in early May to its high in early July, peaking about 3 weeks before the market high in early August. AT weakness in the recent move means large caps have been outperforming the small caps, a condition indicative of a developing top.

Seasonality
The early December seasonal strength ends Monday. The remainder of the week has, on average, been flat.
Conclusion
There are no technical problems in the market and there is no significant seasonal bias for the coming week, but many of the major indices have been up for 6 consecutive weeks and by that measure are overbought. It would not be surprising for the market to consolidate for a while.
I expect the major indices to be lower on Friday December 9 than they were on Friday December 2.
Last week the large cap indices were mostly down less than 1% while the small cap indices were up slightly led by the R2K which was up a little more than 1% so I am calling last weeks positive forecast a tie.
This report is free to anyone who wants it, so please tell your friends. They can sign up at: http://alphaim.net/signup.html. If it is not for you, reply with REMOVE in the subject line.


