• 324 days Could Crypto Overtake Traditional Investment?
  • 329 days Americans Still Quitting Jobs At Record Pace
  • 331 days FinTech Startups Tapping VC Money for ‘Immigrant Banking’
  • 334 days Is The Dollar Too Strong?
  • 334 days Big Tech Disappoints Investors on Earnings Calls
  • 335 days Fear And Celebration On Twitter as Musk Takes The Reins
  • 337 days China Is Quietly Trying To Distance Itself From Russia
  • 337 days Tech and Internet Giants’ Earnings In Focus After Netflix’s Stinker
  • 341 days Crypto Investors Won Big In 2021
  • 341 days The ‘Metaverse’ Economy Could be Worth $13 Trillion By 2030
  • 342 days Food Prices Are Skyrocketing As Putin’s War Persists
  • 344 days Pentagon Resignations Illustrate Our ‘Commercial’ Defense Dilemma
  • 345 days US Banks Shrug off Nearly $15 Billion In Russian Write-Offs
  • 348 days Cannabis Stocks in Holding Pattern Despite Positive Momentum
  • 349 days Is Musk A Bastion Of Free Speech Or Will His Absolutist Stance Backfire?
  • 349 days Two ETFs That Could Hedge Against Extreme Market Volatility
  • 351 days Are NFTs About To Take Over Gaming?
  • 352 days Europe’s Economy Is On The Brink As Putin’s War Escalates
  • 355 days What’s Causing Inflation In The United States?
  • 356 days Intel Joins Russian Exodus as Chip Shortage Digs In
  1. Home
  2. Markets
  3. Other

Elliott Wave Analysis on USDCAD And FTSE100

USDCAD

We know that USDCAD is trapped in a two month consolidation pattern, probably a triangle. On the 1h chart we see price turning up now above the channel resistance line that puts wave D) in play for 1.3050-1.3080 area, where another and final pullback may occur down for wave E) to complete this very complex correction.

USDCAD, 1H

USD/CAD 1-Hour Chart


FTSE 100

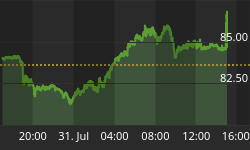
We see European stocks turning slightly to the downside today, most likely into a new corrective setback. DAX already lost 150 points, so we think that lower prices may also follow on the UK Index. From a technical perspective we see waves A down and B up to around 6660, from where price may turn down for wave C, third leg of a corrective retracement, that can be headed down to 6540 gap area to complete a contra-trend structure.

FTSE100, 15Min

FTSE100 15-Minute Chart


Interested in our services? We have a Special Offer : Get First 2 Months For The Price Of 1!! Grab the opportunity now at www.ew-forecast.com


Back to homepage

Leave a comment

Leave a comment