• 785 days Will The ECB Continue To Hike Rates?
  • 785 days Forbes: Aramco Remains Largest Company In The Middle East
  • 787 days Caltech Scientists Succesfully Beam Back Solar Power From Space
  • 1,187 days Could Crypto Overtake Traditional Investment?
  • 1,191 days Americans Still Quitting Jobs At Record Pace
  • 1,193 days FinTech Startups Tapping VC Money for ‘Immigrant Banking’
  • 1,196 days Is The Dollar Too Strong?
  • 1,197 days Big Tech Disappoints Investors on Earnings Calls
  • 1,198 days Fear And Celebration On Twitter as Musk Takes The Reins
  • 1,199 days China Is Quietly Trying To Distance Itself From Russia
  • 1,200 days Tech and Internet Giants’ Earnings In Focus After Netflix’s Stinker
  • 1,204 days Crypto Investors Won Big In 2021
  • 1,204 days The ‘Metaverse’ Economy Could be Worth $13 Trillion By 2030
  • 1,205 days Food Prices Are Skyrocketing As Putin’s War Persists
  • 1,207 days Pentagon Resignations Illustrate Our ‘Commercial’ Defense Dilemma
  • 1,207 days US Banks Shrug off Nearly $15 Billion In Russian Write-Offs
  • 1,211 days Cannabis Stocks in Holding Pattern Despite Positive Momentum
  • 1,211 days Is Musk A Bastion Of Free Speech Or Will His Absolutist Stance Backfire?
  • 1,212 days Two ETFs That Could Hedge Against Extreme Market Volatility
  • 1,214 days Are NFTs About To Take Over Gaming?
Another Retail Giant Bites The Dust

Another Retail Giant Bites The Dust

Forever 21 filed for Chapter…

What's Behind The Global EV Sales Slowdown?

What's Behind The Global EV Sales Slowdown?

An economic slowdown in many…

How The Ultra-Wealthy Are Using Art To Dodge Taxes

How The Ultra-Wealthy Are Using Art To Dodge Taxes

More freeports open around the…

  1. Home
  2. Markets
  3. Other

Elliott Wave Analysis On 10 Year US Notes And SP500

10 Year US Notes

10 Year US Notes are trading at new low, but this may be only a spike in wave B that is part of an ongoing correction. We are still waiting on a completed A-B-C  structure, which is now a flat, so price can rally back to 132,00 level before downtrend resumes.

10 Year US Notes, 1H

US 10-Year Noyes 1-Hour Chart


S&P500

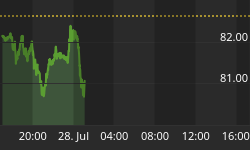
S&P500 is trading at the highs, so we see a completed red wave 4) at 2152 as a triangle. That said a new five wave bullish structure can be underway within red wave 5). If we are correct then strong leg up in sub-wave 3 is around the corner. We remain bullish as long as price is trading above 2152; break beneath that level will suggest that the red wave 5) is already finished.

S&P500, 1H

S&P500 1-Hour Chart


Interested in our services ? We have a Special Offer : Get First 2 Months For The Price Of 1!! Grab the opportunity now at www.ew-forecast.com


Back to homepage

Leave a comment

Leave a comment