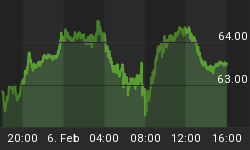
My biggest concern regarding the last low on June 27th was the fact that the Dow Indu did not make an intervening high on June 8 as the SPX did, which means the Dow Indu likely finished wave Y on July 14th AND June 8th was NOT wave Y of an XYZ bull flag for the SPX, but rather Wave W of a bearish WXY flag! It had the appearance of a Y wave on the SPX (and other indices), so the June 27 low appeared to be a Z wave when in fact it was likely an X wave, but shot the market higher anyway as Wave Y had to play out with a y of Y type wave.
Another thing is, the GDX is making a double top and Mars goes into Sagittarius from Scorpio on August 2. Usually, and in the past, GDX tops the last day of Mars in Scorpio which is August 1. I believe we see a gap up to 30.91 then all the way down to 24.80 by Aug 4, the time Equality of Waves principle of gold from May 2 to June 1 x wave of B = z of B on August 4 (July 6 - August 4), Y being the July 6 top. The % expected drop from 30.91 to 24.80 (the c wave of Y taken out and hitting the second touch point of the rising wedge) happened last time from August 21-26, 2016 during the August 18-24 meltdown. At that time, GDX lagged the SPX low by 2 TD's. This time, I believe it pretty much nails the low at the same time for both, that is August 5th +/- one trading day.
That being said, I think the SPX will top out Monday (Venus trines Uranus, 8 TD top) and is possibly due to drop into the mid 1900's next week and by August 5th.
The dollar chart looks to make a top on August 4th also and has finished or close to finishing its bottom, via the recent 9 TD tops.
The COT shows the large specs vs. the commercials to be most lopsided in the gold trade, but still the sentiment among stock traders is surprisingly bullish right now.
So to recap, this time the dollar goes up and the stock market and GDX drops. In August 2015, it was the complete opposite. Gold looks more bearish than the stock market to me, but still the stock market dropping could be the catalyst for the precious metals arena to force liquidate (unexpected news event?).
There are a few different scenarios that could occur regarding the precious metals market's possibilities in conjunction with the stock market dropping this next week, but everything I'm reading says down for both.
Uranus Retrograde: expect the unexpected!
Brad Gudgeon, editor and author of the BluStar Market Timer, is a market veteran of over 30 years. The subscription website is www.blustarmarkettimer.info


