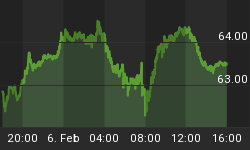
The charts below of GLD and GDX show remarkable differences, at the same time there are similarities. GDX is coming into the 22 TD low due August 24 and we have Mercury Stationary/Retrograde due August 30. In the past, Mercury Stationary/Retrograde has marked an important top within a 2 trading day +/- range of the actual date. In May of this year, it topped right on the exact date, May 2nd.
The e-wave look suggests a continuation "xyz" B Wave pattern for GDX and an "abc" B Wave pattern for GLD. Both of these are bull flags. Mars squares Saturn on August 24th and translates the Saturn/Neptune square through the 26th. This time frame has a war-like look to it and possible terrorist attacks may be in our near future (I hope I’m wrong). Heightened tensions could be the catalyst for higher gold prices into next week.
GDX has had a recurring 10-11 month low cycle, which is due again in November (along with the 8-year cycle low due Oct-Dec 2016). This may mean that we see an "abc" type down move into November. The stock market also has an ominous WXY "Y" wave look to it, which interpreted suggests an irregular e-wave bearish flat flag with strong down side potential into the 40 week trading low due around November 21 (strong downside force especially for the month of November, which may be election jitters related).
Normally, the precious metals complex makes its absolute low at the end of the year of the 8-year cycle, not the beginning, which makes this year rather odd. With a possible move down to SPX 1640 by November on my radar, this coming meltdown in stocks could be the catalyst for forced liquidation of the mining stocks. Normally, I would think we see new lows for this sector, but we have come off of such oversold territory already, it would hard to imagine much lower prices than we have already seen in January.
I’m offering a special 2 for 1 subscription offer good until the end of August. See my website for details.
Brad Gudgeon, editor and author of the BluStar Market Timer, is a market veteran of over 30 years. The subscription website is www.blustarmarkettimer.info


