• 963 days Will The ECB Continue To Hike Rates?
  • 963 days Forbes: Aramco Remains Largest Company In The Middle East
  • 965 days Caltech Scientists Succesfully Beam Back Solar Power From Space
  • 1,365 days Could Crypto Overtake Traditional Investment?
  • 1,370 days Americans Still Quitting Jobs At Record Pace
  • 1,372 days FinTech Startups Tapping VC Money for ‘Immigrant Banking’
  • 1,375 days Is The Dollar Too Strong?
  • 1,375 days Big Tech Disappoints Investors on Earnings Calls
  • 1,376 days Fear And Celebration On Twitter as Musk Takes The Reins
  • 1,378 days China Is Quietly Trying To Distance Itself From Russia
  • 1,378 days Tech and Internet Giants’ Earnings In Focus After Netflix’s Stinker
  • 1,382 days Crypto Investors Won Big In 2021
  • 1,382 days The ‘Metaverse’ Economy Could be Worth $13 Trillion By 2030
  • 1,383 days Food Prices Are Skyrocketing As Putin’s War Persists
  • 1,385 days Pentagon Resignations Illustrate Our ‘Commercial’ Defense Dilemma
  • 1,386 days US Banks Shrug off Nearly $15 Billion In Russian Write-Offs
  • 1,389 days Cannabis Stocks in Holding Pattern Despite Positive Momentum
  • 1,390 days Is Musk A Bastion Of Free Speech Or Will His Absolutist Stance Backfire?
  • 1,390 days Two ETFs That Could Hedge Against Extreme Market Volatility
  • 1,392 days Are NFTs About To Take Over Gaming?
  1. Home
  2. Markets
  3. Other

Will There Be an Inverted Head and Shoulder Pattern on The VIX?

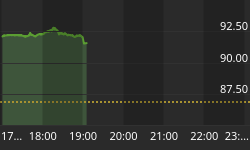
The current VIX chart is posted below.

Take a look at the VIX since the beginning of July. What you should notice is that the VIX had a low on July 20 and then its lowest low on August 9th., and then a low on August 19th.

What is a possible description for that action? Well, the VIX could be forming an inverted Head & Shoulder pattern which would have upside implications if the pattern completes. And since the VIX moves opposite to the stock market, Caution would be in order during the coming days.

VIX Daily Chart


Back to homepage

Leave a comment

Leave a comment