


EURGBP
EURGBP is in sharp move down following much better than expected UK Manufacturing PMI figures (53.3 vs 49.1). But despite strong leg down we see EURGBP in wave 5) here still, but with an extended structure now that is trading towards 0.8350 zone where we may see limited downside as new corrective bounce will be expected to unfold.
EURGBP, 4H

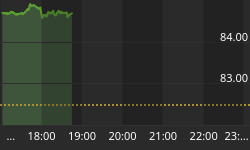
S&P500
E-mini S&P500 is showing a triangle in progress, currently turning down for wave E which is last leg of the pattern so weakness may stop at the lower side of a range. If we are correct then new bullish leg will start in the next 24 hours, maybe after the NFP report tomorrow.
S&P500, 1H

Interested in our services? We have a Special Offer: Get 1 Month Access For 1€!! Grab the opportunity now at www.ew-forecast.com You can even subscribe to our Twitter account -> @ewforecast


