• 178 days Will The ECB Continue To Hike Rates?
  • 178 days Forbes: Aramco Remains Largest Company In The Middle East
  • 180 days Caltech Scientists Succesfully Beam Back Solar Power From Space
  • 580 days Could Crypto Overtake Traditional Investment?
  • 585 days Americans Still Quitting Jobs At Record Pace
  • 587 days FinTech Startups Tapping VC Money for ‘Immigrant Banking’
  • 590 days Is The Dollar Too Strong?
  • 590 days Big Tech Disappoints Investors on Earnings Calls
  • 591 days Fear And Celebration On Twitter as Musk Takes The Reins
  • 593 days China Is Quietly Trying To Distance Itself From Russia
  • 593 days Tech and Internet Giants’ Earnings In Focus After Netflix’s Stinker
  • 597 days Crypto Investors Won Big In 2021
  • 597 days The ‘Metaverse’ Economy Could be Worth $13 Trillion By 2030
  • 598 days Food Prices Are Skyrocketing As Putin’s War Persists
  • 600 days Pentagon Resignations Illustrate Our ‘Commercial’ Defense Dilemma
  • 601 days US Banks Shrug off Nearly $15 Billion In Russian Write-Offs
  • 604 days Cannabis Stocks in Holding Pattern Despite Positive Momentum
  • 605 days Is Musk A Bastion Of Free Speech Or Will His Absolutist Stance Backfire?
  • 605 days Two ETFs That Could Hedge Against Extreme Market Volatility
  • 607 days Are NFTs About To Take Over Gaming?
  1. Home
  2. Markets
  3. Other

Elliott Wave Analysis On EURGBP And EURJPY

EURGBP

EURGBP is in sharp and impulsive sell-off for the last two or three weeks, currently with red wave 5) still in progress which should be structured by five subwaves, so current leg from 0.8565 can extend even to 0.8300 this week, or to 0.8260 before support will be seen for a turn up into a corrective A)-B)-C) run.

EURGBP, 4H

EUR/GBP 4-Hour Chart


EURJPY

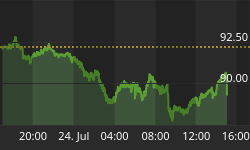
EURJPY is turning slightly lower for the last 24 trading hours, away from 61.8% Fibonacci level where market might already accomplished a three wave of recovery up into wave c-circled that belongs to a big triangle formation. So if we are on the right track then current minor turn down can be start of a wave d decline towards the lower side of a contracting range.

EURJPY, 4H

EUR/JPY 4-Hour Chart


Interested in our services? We have a Special Offer: Get 1 Month Access For 1€!! Grab the opportunity now at www.ew-forecast.com You can even subscribe to our Twitter account -> @ewforecast


Back to homepage

Leave a comment

Leave a comment