


The good news is:
• The recent weakness appears to be no more than a seasonally timedconsolidation following the rapid move up from the October low.
Short term
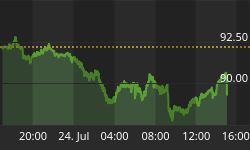
The chart below shows the NASDAQ composite (OTC) in red along with momentum of 3 oscillators derived from NASDAQ data. It covers the period from mid July through last Friday and vertical dashed lines are drawn on the 1st trading day of each month; the horizontal dashed line represents neutral for the momentum indicators.
Oscillators have min-max limits and, no matter how persistent the trend they will regress to 0. Momentum indicators applied to oscillators smooth and exaggerate the behavior of the oscillators.
The oscillators underlying these indicators are calculated from advancing issues - declining issues (AD), new highs - new lows (HL) and upside volume - downside volume (UD).
The indicators are as low as they have been at any time in the past month, but Friday's positive action was not enough to turn any of them upward.

Intermediate term
The NASDAQ new low indicator (OTC NL) is a 10% trend (19 day EMA) of NASDAQ new lows plotted on an inverted Y axis so increasing new lows move the indicator downward and decreasing new lows move the indicator upward (up is good). While prices moved downward last week there were not enough new lows to break the upward trend of the indicator.

The small caps usually lead both up and down.
The chart below shows Accutrack (AT) (a FastTrack relative strength indicator) in black comparing the Russell 2000 (R2K) and the S&P 500 (SPX) in black along with the OTC in red. The chart covers the period from mid July through last Friday.
During the weakness of the past week the R2K has been outperforming the SPX. I have marked a similar occurrence in mid to late August when AT advanced for a week or so while prices fell. That occurrence was followed by a sharp advance in prices.

Seasonality
Options and futures expiration has been blamed for market volatility beginning in the mid 80's. However, volatility prior to the 3rd Friday of December during the 1st year of the Presidential Cycle was more severe during the 20's 30's and 40's than it has been in the past 20 years that futures and options have been an issue.
In recent years (OTC 1965 on) more of the days have been up, but the averages down indicating the down days go down more than the up days go up.
For the week the OTC since 1965 has been up only 30% of the time while the SPX since 1929 has been up 47% of the time.
Report for the week before options and futures expiration in December.
The number following the year is the position in the presidential cycle.
Daily returns from Monday to witching Friday.
| OTC Presidential Year 1 | ||||||
| Year | Mon | Tue | Wed | Thur | Fri | Totals |
| 1965-1 | 0.81% | 0.12% | 0.27% | 0.14% | -0.07% | 1.27% |
| 1969-1 | 0.04% | 0.14% | -0.54% | -0.66% | 1.28% | 0.26% |
| 1973-1 | -0.56% | 1.60% | -0.35% | 0.03% | -0.83% | -0.10% |
| 1977-1 | 0.31% | 0.20% | -0.13% | -0.07% | 0.15% | 0.46% |
| 1981-1 | -1.50% | -0.26% | -0.04% | 0.31% | 0.67% | -0.81% |
| Avg | -0.18% | 0.36% | -0.16% | -0.05% | 0.24% | 0.21% |
| 1985-1 | 0.36% | -0.59% | -0.24% | 0.06% | 0.14% | -0.27% |
| 1989-1 | -0.83% | -0.44% | 0.16% | -0.81% | -0.81% | -2.74% |
| 1993-1 | -0.13% | -1.09% | 0.20% | 0.34% | 0.49% | -0.19% |
| 1997-1 | 0.00% | 1.07% | -0.36% | -1.56% | 0.10% | -0.76% |
| 2001-1 | 1.76% | 0.87% | -1.09% | -3.25% | 1.42% | -0.29% |
| Avg | 0.29% | -0.03% | -0.27% | -1.04% | 0.27% | -0.85% |
| OTC summray for Presidential Year 1 1965 - 2001 | ||||||
| Avg | 0.03% | 0.16% | -0.21% | -0.55% | 0.25% | -0.32% |
| Win% | 56% | 60% | 30% | 50% | 70% | 30% |
| OTC summary for all years 1963 - 2004 | ||||||
| Avg | 0.07% | 0.00% | -0.05% | -0.03% | 0.13% | 0.11% |
| Win% | 50% | 50% | 49% | 60% | 57% | 57% |
| SPX Presidential Year 1 | ||||||
| Year | Mon | Tue | Wed | Thur | Fri | Totals |
| 1929-1 | -2.87% | 1.08% | -0.65% | -2.66% | -3.31% | -8.41% |
| 1933-1 | 0.29% | -0.19% | -0.97% | 0.39% | -1.56% | -2.05% |
| 1937-1 | -3.33% | 0.84% | 0.74% | 1.56% | -0.72% | -0.92% |
| 1941-1 | 0.11% | -0.23% | -1.61% | -0.93% | 0.00% | -2.66% |
| 1945-1 | -2.31% | 0.94% | 0.00% | -0.64% | -0.06% | -2.06% |
| 1949-1 | 0.73% | 0.42% | 0.18% | 0.06% | -0.12% | 1.27% |
| 1953-1 | -0.28% | 0.08% | 1.01% | -0.08% | 0.20% | 0.93% |
| 1957-1 | -1.50% | -1.74% | -0.10% | 1.07% | -0.80% | -3.08% |
| 1961-1 | 0.49% | 0.35% | -0.15% | -0.76% | 0.04% | -0.04% |
| Avg | -0.57% | 0.01% | 0.23% | -0.07% | -0.15% | -0.60% |
| 1965-1 | 0.03% | 0.05% | 0.15% | 0.11% | -0.04% | 0.30% |
| 1969-1 | -0.30% | -0.91% | -0.58% | 1.58% | 0.85% | 0.65% |
| 1973-1 | -0.58% | 2.15% | 0.08% | -0.28% | -1.07% | 0.30% |
| 1977-1 | -0.02% | -0.07% | 0.50% | -0.51% | -0.16% | -0.26% |
| 1981-1 | -1.72% | 0.17% | -0.46% | 0.57% | 0.71% | -0.73% |
| Avg | -0.52% | 0.28% | -0.06% | 0.29% | 0.06% | 0.05% |
| 1985-1 | 0.99% | -0.65% | -0.40% | 0.10% | 0.44% | 0.48% |
| 1989-1 | -0.04% | 0.91% | 0.29% | -0.52% | -0.23% | 0.42% |
| 1993-1 | 0.38% | -0.57% | -0.26% | 0.32% | 0.66% | 0.53% |
| 1997-1 | 1.05% | 0.48% | -0.26% | -1.06% | -0.89% | -0.68% |
| 2001-1 | 1.00% | 0.75% | 0.58% | -0.84% | 0.44% | 1.94% |
| Avg | 0.68% | 0.19% | -0.01% | -0.40% | 0.08% | 0.54% |
| SPX summary for Presidential year 1 1929 - 2001 | ||||||
| Avg | -0.41% | 0.20% | -0.11% | -0.13% | -0.31% | -0.74% |
| Win% | 47% | 63% | 44% | 47% | 39% | 47% |
| SPX summary for all years 1928 - 2004 | ||||||
| Avg | -0.07% | 0.08% | 0.11% | -0.06% | 0.19% | 0.25% |
| Win% | 54% | 48% | 51% | 45% | 58% | 58% |
Conclusion
Last week the market entered a typical consolidation which should end next week. In recent times Wednesday and Thursday have been the worst days of the upcoming week; look for the consolidation to end then.
I expect the major indices to be lower on Friday December 16 than they were on Friday December 9.
This report is free to anyone who wants it, so please tell your friends. They can sign up at: http://alphaim.net/signup.html. If it is not for you, reply with REMOVE in the subject line.
Gordon Harms produces a Power Point for the monthly meetings of our local timing group. You can get it with the following link: http://www.stockmarket-ta.com/research/Dec6,2005.PPT


