• 742 days Will The ECB Continue To Hike Rates?
  • 743 days Forbes: Aramco Remains Largest Company In The Middle East
  • 744 days Caltech Scientists Succesfully Beam Back Solar Power From Space
  • 1,144 days Could Crypto Overtake Traditional Investment?
  • 1,149 days Americans Still Quitting Jobs At Record Pace
  • 1,151 days FinTech Startups Tapping VC Money for ‘Immigrant Banking’
  • 1,154 days Is The Dollar Too Strong?
  • 1,154 days Big Tech Disappoints Investors on Earnings Calls
  • 1,155 days Fear And Celebration On Twitter as Musk Takes The Reins
  • 1,157 days China Is Quietly Trying To Distance Itself From Russia
  • 1,157 days Tech and Internet Giants’ Earnings In Focus After Netflix’s Stinker
  • 1,161 days Crypto Investors Won Big In 2021
  • 1,161 days The ‘Metaverse’ Economy Could be Worth $13 Trillion By 2030
  • 1,162 days Food Prices Are Skyrocketing As Putin’s War Persists
  • 1,164 days Pentagon Resignations Illustrate Our ‘Commercial’ Defense Dilemma
  • 1,165 days US Banks Shrug off Nearly $15 Billion In Russian Write-Offs
  • 1,168 days Cannabis Stocks in Holding Pattern Despite Positive Momentum
  • 1,169 days Is Musk A Bastion Of Free Speech Or Will His Absolutist Stance Backfire?
  • 1,169 days Two ETFs That Could Hedge Against Extreme Market Volatility
  • 1,171 days Are NFTs About To Take Over Gaming?
Is The Bull Market On Its Last Legs?

Is The Bull Market On Its Last Legs?

This aging bull market may…

The Problem With Modern Monetary Theory

The Problem With Modern Monetary Theory

Modern monetary theory has been…

  1. Home
  2. Markets
  3. Other

Elliott Wave Analysis On Silver And USDJPY

Silver

Metals are higher today, with gold at 1316 and silver at 19.24 after it hit 18.65 on Friday. We see quite nice strong turn up on silver, clearly in five waves so we can expect more upside after any short-term correction. Ideally we are going higher now into wave D which should be made by three legs so we would not be surprised if market would rally up to around 19.50 zone.

Silver, 1H

Sulver 1-Hour Chart


USDJPY

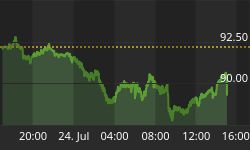
USDJPY is ticking lower, now breaking through the trendline support connected from September low which indicates that wave C is in play. We see pair falling towards the 100.50-100.70 area where wave D) can find looking for some support, as part of a higher degree triangle.

USDJPY, 1H

USD/JPY 1-Hour Chart


Interested in our services? We have a Special Offer: Get 1 Month Access For 1€!! Grab the opportunity now at www.ew-forecast.com You can even subscribe to our Twitter account -> @ewforecast


Back to homepage

Leave a comment

Leave a comment