


This report will look at the Daily, Weekly and Monthly charts Gold. A description of the current trends, support and resistance levels and where each of these markets appear to be heading will follow each chart.
Below is an explanation of the three windows of the charts and a description of each of the indicators.
In the top window is my internal strength indicator (represented by a bold blue line) this measures the strength of the security in relation to its movement between the upper and lower 3rd alpha wave bands.
The internal strength indicator is considered overbought above minus twenty (-20), and oversold below minus eighty (-80). In addition to the internal strength indicator there are two other indicators. The thin blue indicator represents the value of the last time the internal strength indicator reversed direction to the downside. The thin red line represents the value of the last time the internal strength indicator reversed direction to the upside.
In the middle widow the Long/Short position is indicated, one (1) represents a long position, minus one (-1) represents a short position. A zero (0) represents a neutral position. The Bold blue line is for long term traders and the thin red line is for short term traders.
In the bottom chart the main trend line for a security is the Alpha Trend this is represented by the bold red line. It is from this trend line that all other support/resistance lines are developed. The Alpha Trend is an adaptive moving average that uses proprietary mathematical formulas to create the base line movement of the selected security. From the Alpha Trend, I then created three separate progression/regression price areas using Fibonacci ratios, which I call the 1st Alpha waves, 2nd Alpha waves and 3rd Alpha waves. It is these three wave areas that define the vast majority of a security's price movement. Moving out from the Alpha Trend, the 1st Alpha waves are represented by the dark blue lines. This is the price range that a security will normally move to once the Alpha Trend line is crossed in either direction. Next are the 2nd Alpha waves which are represented by the light blue lines. It is this area between the 2nd Alpha waves where 79.82% of the time a security‘s price will remain. Last are the 3rd Alpha waves which are represented by the violet lines. Once a security's price reaches this area it is in an extreme overbought/oversold condition. A security can stay in this area for awhile, but this usually represents a poor price in which to place a trade in the prevailing trend.
The next four moving averages are the one year moving average of the Alpha Trend represented by the bold violet line. The timeframe for this moving average is the following, on the daily chart it is 240 trading days, on the weekly chart it 52 trading weeks, and on the monthly chart it is 12 trading months. The next moving average is the short term alpha trend line represented by the bold black line. The next moving average is a simple moving average of the lows when the internal strength indicator is trending up. This moving average is represented by the Bold Blue line. The last moving average is a simple moving average of the highs as the internal strength indicator is trending down. This moving average is represented by the Bold Green line.

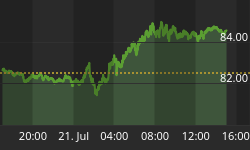
Above is the chart for Daily Gold.
The current short term traders' position is Short.
The current long term traders' position is Short.
The current sell price for short term traders is 508.0110.
Long term traders' stop loss price is 519.36.
Today's closing price is 2.7643 percent to the support price of Alpha Trend.
The Alpha Trend Support price is 494.6272.
Today's closing price is 15.5804 percent to the support price of the one year moving average of the Alpha Trend.
The one year moving average of the Alpha Trend Support price is 439.7805.
The internal strength indicator is trending down.
On November 9 we went long Gold, with an entry price of 467.60. On December 12 we were stopped out at 524.70. Currently both long and short term traders are short Gold. Today Gold gapped down below the upper 1st Alpha wave band then tried to rally back up to the short term alpha trend line and then gave it all back and closed below the upper 1st alpha wave band. This price action does not bode well for Gold. Gold is declining to the Alpha Trend support line price currently at 494.63 on the Daily chart. The internal strength indicator is at -18.39 and is trending down, a reading below -20 and the internal strength indicator will move out of the over bought level. If the Gold fails to hold at the Alpha Trend support price the next support price after that is the lower 1st alpha wave band price of 473.54.

Above is the weekly chart for Gold.
The current short term traders' position is Long.
The current long term traders' position is Neutral.
All traders are out.
The Current trend is bullish.
The Alpha Trend is trending up.
Today's closing price is 10.7113 percent to the support price of Alpha Trend.
The Alpha Trend Support price is 459.1221.
The one year moving average of the Alpha Trend is trending up.
Today's closing price is 17.5121 percent to the support price of the one year moving average of the Alpha Trend.
The one year moving average of the Alpha Trend Support price is 432.5512.
The internal strength indicator is trending down.
Last week and Monday of this week Gold was able to remain above the upper 3rd alpha wave band, however on Tuesday and today Gold remained below this support price. The internal strength indicator is trending down and is currently at -15.67. Both of these conditions indicate that Gold can continue to decline to at least the upper 2nd alpha wave band support price of 503.45, if this support price can not hold the next support is the upper 1st alpha wave band price of 489.94.

Above is the monthly chart for Gold.
The current short term traders' position is Long.
The current long term traders' position is Long.
The current sell price is 542.4250.
The Current trend is bullish.
The Alpha Trend is trending up.
Today's closing price is 19.4493 percent to the support price of Alpha Trend.
The Alpha Trend Support price is 425.5363.
The one year moving average of the Alpha Trend is trending up.
Today's closing price is 24.7107 percent to the support price of the one year moving average of the Alpha Trend.
The one year moving average of the Alpha Trend Support price is 407.5834.
The relative strength indicator is trending up.
On the monthly chart Gold rallied $1.91 above the upper 3rd alpha wave band price of 542.59 additionally; traders sold their long positions at 542.43. Gold appears to be pulling back the next support price which is the upper 2 nd alpha wave band price currently at 502.36. If this support price doesn't hold the next support price is the upper 1st alpha wave band price of 477.50.
In conclusion Gold has rallied above the upper 3rd alpha wave band on all three charts, which is a very good indication that this market is topping out. Gold is currently trending down the next major support price is 494.63-503.45. 494.63 is the Alpha Trend line price from the Daily chart and 503.45 is the upper 2nd alpha wave band from the weekly charts. If this support range fails to hold the next support range is 473.54 - 477.50, 473.54 is the lower 1st alpha wave band from the Daily chart and 477.50 is the upper 1st alpha wave band from the Monthly chart.


