


EURJPY
On the EURJPY we are observing a corrective part of a higher degree triangle consolidation taking place, with the final wave E and its sub-wave A) in motion.
As we see on the chart, we expect the completion of this triangle around the 114.90/115.10 area from where we expect resistance to show up, ideally at the previous swing X at the 114.737 mark.
From there more weakness may follow and ideally a nice sell-off.
EURJPY, 1H

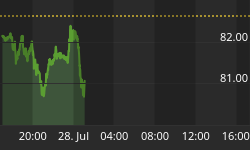
USDJPY
USDJPY is trading quite bullish, currently tracing out the fifth wave of an impulsive sequence with minor red leg iii) in progress.
The ongoing movement has three waves, meaning we need two more legs to complete the whole pattern from the 103.165 mark. That said the main resistance levels are around the 105.30/105.50 region from where we expect a reversal.
USDJPY, 1H

Triangles are overlapping five wave affairs that subdivide 3-3-3-3-3. They appear to reflect a balance of forces, causing a sideways movement that is usually associated with decreasing volume and volatility.
A Basic Triangle Correction:

Interested in our services? We have a Special Offer: Get 14 Days Access For 1€!! Grab the opportunity now at www.ew-forecast.com You can even subscribe to our Twitter account -> @ewforecast


