


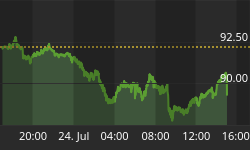


In my last piece on US stocks, dated August 28, 2005, I suggested, for various reasons, that a rally to at least 1260 SPX and as high as 1300 SPX was a good bet. It took a gut wrenching October selling event to finally spawn this big rally but here we are a week before X-Mas sitting at 1267, about a hundred points above the October lows. The trend from the October lows is still up so why should there be concern about moving even higher?
Trend following traders have a good methodology; they find a trending market and execute buy and sell signals based on the trend. It is Occam's Razor at its best. But most humans deplore simplicity and seek a complex challenge. In the financial markets, this equates with trying to top and bottom pick, most often a financially suicidal endeavour for such Heros. Therefore, I will attempt to be a Hero and present a three pronged argument that this move up is about to come to an end of at least the rally sequence from the October 2005 lows and potentially the entire bull market from the October 2002 lows, after one more leg up.
Sentiment
It is running high again which is bearish. In fact, last Thursday, the Put/Call plunged to levels not seen since the mania days of 2000. Have we reached the greed stage of this bull market where a further rally is regarded as a foregone conclusion? Perhaps.
Cycles
The four year cycle in US stocks is due to bottom in the fall of 2006 so we should expect the markets to get at least a 15-20% haircut from their peak until fall 2006. Of course, this methodology is not foolproof as we saw in 1986 when everybody was expecting a bottom in late 1986 and the cycle right translated into late 1987. Nevertheless, cycles tell us that 2006 will be a down year.
Elliott/Fibonacci
The US indices were locked in a triangular trading range from early 2004 until October 2005. The move out of these ranges off the October 2005 bottom can be seen as a "thrust" out of a triangle, which, with few exceptions, is a final move in an Elliott sequence. Thrust targets for the various indices are SPX 1300-1325, DOW 11000-11400, and NDX 1800-1900, but quite often a market will make a new high while falling short of the actual thrust target. The triangle is most pronounced in the NDX where it lasted a Fibonacci 89 weeks.
Momentum for the up move from the October lows peaked on November 23 after two rally legs. In Elliott terms, one might say that the top of wave 3 was reached on that date. Since then, the indices have been in a sideways consolidation pattern which should resolve to the upside this Monday, December 19, to give one more rally leg up; that is, Wave 5 of the thrust out of the 89 week triangle. In other words, the final move. The sideways pattern is most pronounced in the NDX where the final leg should equal 46 points which is where wave 5 would be .618 times wave 1 and equal to the largest segment of the sideways consolidation, also a triangle. Given Friday's low of 1688, this would bring the NDX to 1734 before year end. Incidently, 1734 is also a rally top from December 2001. It thus represents a massive cluster of resistance.
Finally, early January 2006 is a Fibonacci 55 weeks from the December 2004 momentum highs and a Fibonacci 34 weeks from the May 2005 lows. It is also a Fibonacci 34 months from the March 2003 pivot lows.
All of the above suggests that early January 2006 may mark a significant top in stocks. But the smart will wait for the trend to turn down before they sell because it ain't over 'till it's over.


