


Financial markets are becoming absolutely giddy with delight as they are now firmly looking beyond their "dark night of captivity" to the Obama administration's growth killing regulatory scheme with all its oppressive mandates to a "new morning" of a business friendly Trump administration.
Wall Street is sensing growth and investors are responding by unceremoniously trash-canning the safe haven or defensive categories of stocks.
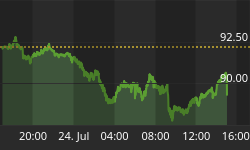
Witness the carnage in the Utility sector:

AND in the Defensive Consumer Staples sector:

Notice both charts contain the dreaded technical "Death Cross". That is a long term negative chart signal. What it is telling us is that DEFENSIVE stocks for a SLOW GROWTH scenario are now fully out of favor with investors now in the mood for growth stocks or stocks that are going to perform well during a period of economic expansion.
Witness what we saw today in the Financials sector with the surge higher in bank stocks over the past two days.
Consider the high-beta Russell 2000 which just a few days ago looked as if it was ready to give up the ghost and completely fall apart. It is now pushing back up near all-time highs again ( this is the emini Russell 2000).

All of this has HUGE implications for gold, none of it any good.
Gold has fallen apart technically and is now back below its 200 day moving average. It goes without much saying that a fall through the October lows near $1240 would send the metal down to $1210-$1200.


Gold owes its woes not to "manipulation" like the gold RA-RA sites are all screaming again (ad infinitum, ad nauseam) but to this rush out of defensive/safe haven/risk aversion trades or investments and into growth trades. Additionally, the strongly higher US Dollar will work to provide additional headwinds to the yellow metal.

If the Dollar takes out today's high and can hold above it, it is going to make a run to 100 basis the USDX and it would not surprise me to see it easily press through that level.
Investors around the globe are looking at the US under a new Trump administration and are getting excited about growth prospects.
Speaking of the growth prospects - traders might want to take a serious look at playing the growth trade and running some long silver/short gold spreads. The silver/gold ratio runs strongly in favor of silver during periods of growth.
Here is the monthly chart of that same ratio. Notice how it did when the Fed unleashed its first round of QE back in early 2009. It looks to be coming off a bottom that has held all the way back to 1995.


The only fly I see in the RISK ON ointment at this time is the fact that the commodity currencies, (the Canadian, and Australian Dollars) are not breaking out to the upside. I think however that can be explained by the fact that the US Dollar is so incredibly strong at the moment that many are afraid to sell it, even on those commodity currency crosses.
It looks as if the world is looking at the US as the place to be for next year.


