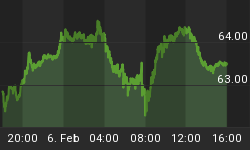
Crude OIL
On the intraday chart of Crude OIL, we are observing a nice minimum three wave rise to the upside unfolding from recent 42.18 low, with first wave A potentially already completed. As we see on the chart wave A is constructed by five sub-waves, meaning a possible three wave correction may be around the corner in the second wave B. If that will happen, then we may expect a nice region of support to take place around the 43.80-44.75, where some Fibonacci ratios can take price higher into wave C.
Crude OIL, 1H

GBPUSD
Cable is currently trading quite lower, probably undergoing a minimum three wave correction from recent 1.2673 highs, where we labeled end of wave 5). If that is the case, then we can see first wave A) already completed as an leading diagonal, followed by a intraday bounce, that could be part of the second corrective wave B). The ideal resistance area and reversal zone for this corrective wave B) could be around the 61.8 Fibonacci ratio, from where bears may again take over.
GBPUSD, 1H

When diagonal triangles occur in the fifth or C wave position, they take the 3-3-3-3-3 shape that Elliott described. However, it has recently come to light that a variation on this pattern occasionally appears in the first wave position of impulses and in the A wave position of zigzags. The characteristic overlapping of waves one and four and the convergence of boundary lines into a wedge shape remain as in the ending diagonal triangle. However, the subdivisions are different, tracing out a 5-3-5-3-5 pattern.
A Basic Leading Diagonal:

Interested in our services? We have a Special Offer: Get 14 Days Access For 1€!! Grab the opportunity now at www.ew-forecast.com You can even subscribe to our Twitter account -> @ewforecast


