


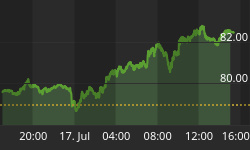


Recently, a friend of mine told me about the timing newsletter to which he subscribes. Evidently, it had recently recommended Japan as a great play. If extrapolating the past few months' returns is the only measure we use in selecting investments, then, indeed, we should all be piling into the Nikkei.

Chart courtesy of StockCharts.com
While no one can state for sure what will happen to the Nikkei over the next few weeks or even months, a quick look at the macroeconomics picture tells us why this recent run-up is likely not signaling a turnaround for Japan.
What I would like to do is take us through the "Museum of Not-Too-Distant History" and examine the returns in the Nikkei. Do they point to the emergence of a "Japanese Ark," with untold wealth for the investors who've found it, or will this ark spell "financial death" for those careless enough to touch it at the wrong time.
Let's start out search by going to the section called the " Museum of Government Debt." As we comb through the artifacts of the Japanese monetary system, we find out that this time it is different. Well, maybe not different but unprecedented in size.
"In 2003 and the first quarter of 2004, Japan carried out a remarkable experiment in monetary policy - remarkable in the impact it had on the global economy and equally remarkable in that it went almost entirely unnoticed in the financial press. Over those 15 months, monetary authorities in Japan created ¥35 trillion. To put that into perspective, ¥35 trillion is approximately 1% of the world's annual economic output. It is roughly the size of Japan's annual tax revenue base or nearly as large as the loan book of UFJ, one of Japan's four largest banks. ¥35 trillion amounts to the equivalent of $2,500 for every person in Japan and, in fact, would amount to $50 per person if distributed equally among the entire population of the planet. In short, it was money creation on a scale never before attempted during peacetime.
The Bank of Japan gave the ¥35 trillion to the Japanese Ministry of Finance in exchange for MOF debt with virtually no yield; and the MOF used the money to buy approximately $320 billion from the private sector. The MOF then invested those dollars into US dollar-denominated debt instruments such as government bonds and agency debt in order to earn a return.
The MOF bought more dollars through currency intervention [this year] than during the preceding 10 years combined, and yet the yen rose by 11% over that period."[Italics and brackets mine] 1
Yet, in some ways the story is the same. As w e cross the hall to the " Museum of Foreign Investment Holdings" section, we see that Japan has been accumulating foreign exchange reserves for decades. So again, purchasing U.S. assets is not a new discovery ensuring a vibrant economic future for Japan.

If we walk to the next exhibit, we can look at Japan's purchases of foreign exchange reserves from our own perspective. Here, we scan a small government document of 198 pages. After turning past the first hundred tables, we come to one called, Foreign Holdings of U.S. Long Term Securities, by Country, as of the Survey Dates. There, buried in a long list of country names, we find Japan.
We notice two things. First, Japan's Ministry of Finance has been increasing their purchases of long-term securities in the U.S. for a number of years. As well, we see that Japan's purchases of U.S. assets have grown exponentially since the year 2000, and that Japan now has the largest amount of financial holdings of U.S. assets of any nation outside the United States.
Dec. | Dec. | Dec. | Dec. | Dec. | Dec. | Dec. | Dec. | |
Japan | 12 | 28 | 180 | 230 | 431 | 529 | 649 | 898 |
The size and scope of these numbers is substantial. From 1984 to 2004, Japan's long-term U.S. securities holdings grew 3100 percent! And for those of you curious about the nation with second highest level of U.S. securities, China's holdings have grown 1,694 percent from 1994 (the year they pegged the Renminbi to the U.S dollar) to 2004. 2
Now, where did Japan get the money to buy all of these U.S. long-term securities?
Like Duncan states above, the Bank of Japan (BOJ) has given trillions of yen to Japan's Ministry of Finance (MOF), in exchange for MOF debt with virtually no yield. The MOF then invested those yen into US dollar-denominated debt instruments such as government bonds and agency debt.
This can be easily verified by looking at another portion of this same 198-page document we mentioned earlier. A few pages prior, it shows the dollar amounts of each type of securities each country owns. Seventy-six percent of Japan's holdings are comprised of U.S. government long-term and short-term debt and U.S. government agencies. 3
So, why has Japan's Ministry of Finance bought our debt?
It is not my intention to delve deeply into the trade balance debate between the U.S. and the Japanese. The fact is Japan experienced a fantastically speculative bubble in its stock and real estate markets, which popped in 1989. Since then the Japan has experienced a protracted bear market with its concomitant economic perils.
True, Japan does earn a return when they invest in U.S. debt. Yet that is not their main objective. In the simplest of terms, Japan buys our debt to make Toyotas and Sonys more affordable for the U.S. consumer. In buying our debt, Japan keeps U.S. dollars out of circulation and, comparatively, more yen in circulation. Thus, with the law of supply and demand, the value of the yen is kept from rising against the dollar. As we depend on imports to keep our economy going, Japan, with little domestic demand, depends heavily on exports to keep their economy afloat.
So, how has it worked?
Though Japan's purchases of U.S. securities may have acted to keep more Japanese people employed, it does not take long to realize that this strategy has done little good for Japan's markets.

Courtesy of www.decisionpoint.com
This chart from the " Museum of Japanese Financial History" reveals that the Nikkei has been trading near 15,800 in mid-December of 2005. While this is up 45 percent from May 2005, it is still 60 percent (23,177 points) lower than the Nikkei's all time high of 38,915 in December of 1989. For those who still don't believe in long term bear markets, let me repeat that year. 1989!
It is also apparent that Japan's policy has done little to benefit the Japanese real estate markets over the last sixteen years.
"The asset-price bubble, however, collapsed from the first business day of 1990, triggering a crash of asset prices. The prices of many shares fell to a fraction of their peak levels. The price of land, which had been believed to be absolutely safe, plummeted, with the price of commercial land in the six major cities tumbling 85%. That is to say, it is now [2001] worth only 15% of its peak price. 4
"[Japanese] national wealth as a whole is now [in 2001] 59% of 1989 levels. With most of the Japanese wealth lost concentrated in the real estate sector, these assets fell to nearly one-tenth of their value." 5
I am a bit amused by those who think this time it is different, while Japan's fundamental macroeconomic environment is little changed over the last fifteen years.
So, the question becomes, "who is buying into the Nikkei?"
Though we cannot answer this question definitively, a closer look at the Japanese culture reveals who it is probably not.
"Although there is a problem in that its [ Japan's] stock market is supported primarily by foreign investors, Japanese nationals make up 95% of its government bond market." 6
You see, savings is still a heavily entrenched value in the Japanese culture. The Flow of funds data from the Bank of Japan,
"shows that the household sector is indicating that high savings are still intact. Moreover, savings behavior of the household sector hardly changed during the 1990s. The sector saved and equivalent of around 7% of GDP at the peak of Japan's asset-price bubble in 1990 and continue[s] to do so." 7
If the Japanese nationals were unwilling to reduce their savings to move money into the Nikkei at its peak, it seems unlikely that they would do so today. Their culture, unlike our own, is still deeply entrenched in the discipline of saving.

On the other hand, many Americans have come to believe that asset appreciation is the same thing as savings. The chart to the right shows this cultural shift in thinking quite well. As the markets have largely increased since the early 1980s, we have seen a corresponding decrease in our personal savings rate. This is accentuated by the recent negative savings rate, which has spanned five months as of October. 8
As further evidence of our propensity to invest in lieu of save, consider where US investors have their retirement funds.
"In 2004, $2.1 trillion (or 70%) of retirement account mutual fund assets were invested in stock funds." 9
So as all the bullish rhetoric comes out about the booming Nikkei, a word of caution is warranted. A look at the not-too-distant history of Japan tells us that little has changed. As various proponents of investing in the Nikkei extrapolate the potential earnings into the future, we do well to remember that extrapolating short-term trends can be very dangerous.
In addressing Alan Greenspan's concerns about the low risk premium, which Greenspan did much to foster, Jeremy Grantham offers an explanation as to why the risk premium remains low. Grantham notes:
"For the time being, we have a strong hunch that the predominant input is extrapolation. That is to say, today's conditions, whatever they are, are assumed to be permanent.
It is of course far more likely that this ration ebbs and flows and that extrapolating the current point, particularly when it is at an extreme, like now, will produce a painfully wrong conclusion.
The probable winning bet is not to extrapolate, but to expect a very mean reversal." 10
Jeremy Grantham, October 2005
Sources:
1. How Japan Refinanced Global Inflation, Richard Benson, Guest Commentary on www.prudentbear.com, May 17, 2005
2. Report on Foreign Portfolio Holdings of U.S. Securities as of June 30, 2004, U.S. Treasury Department, http://www.treas.gov/tic/shl2004r.pdf, Information on Japan is found on page 81. China is on page 78.
3. Ibid, Pg 59
4. Balance Sheet Recession: Japan's Struggle with Uncharted Economics and its Global Implication, Richard Koo, Pg. 4
5. Ibid, Pg 13
6. Ibid, Pg 73
7. Ibid, Pg 6
8. Personal Income and Outlays: October 2005, http://www.bea.gov/bea/newsrelarchive/2005/pi1005.pdf , Bureau of Economic Analysis, U.S. Department of Commerce, Pg. 6
9. Mutual Funds and the U.S. Retirement Markets in 2004, http://www.ici.org/stats/mf/fm-v14n4.pdf , Prepared by the Institute Company Institute, August 2005,
10. The Day of Reckoning or Ready or Not, Here Comes the Risk Premium, GMO Quarterly, October 2005, Jeremy Grantham, Pg 2


