• 678 days Will The ECB Continue To Hike Rates?
  • 678 days Forbes: Aramco Remains Largest Company In The Middle East
  • 680 days Caltech Scientists Succesfully Beam Back Solar Power From Space
  • 1,080 days Could Crypto Overtake Traditional Investment?
  • 1,085 days Americans Still Quitting Jobs At Record Pace
  • 1,087 days FinTech Startups Tapping VC Money for ‘Immigrant Banking’
  • 1,090 days Is The Dollar Too Strong?
  • 1,090 days Big Tech Disappoints Investors on Earnings Calls
  • 1,091 days Fear And Celebration On Twitter as Musk Takes The Reins
  • 1,093 days China Is Quietly Trying To Distance Itself From Russia
  • 1,093 days Tech and Internet Giants’ Earnings In Focus After Netflix’s Stinker
  • 1,097 days Crypto Investors Won Big In 2021
  • 1,097 days The ‘Metaverse’ Economy Could be Worth $13 Trillion By 2030
  • 1,098 days Food Prices Are Skyrocketing As Putin’s War Persists
  • 1,100 days Pentagon Resignations Illustrate Our ‘Commercial’ Defense Dilemma
  • 1,101 days US Banks Shrug off Nearly $15 Billion In Russian Write-Offs
  • 1,104 days Cannabis Stocks in Holding Pattern Despite Positive Momentum
  • 1,105 days Is Musk A Bastion Of Free Speech Or Will His Absolutist Stance Backfire?
  • 1,105 days Two ETFs That Could Hedge Against Extreme Market Volatility
  • 1,107 days Are NFTs About To Take Over Gaming?
  1. Home
  2. Markets
  3. Other

Elliott Wave Analysis: AUDUSD, VIX And NASDAQ

Originally posted at 8:30 am PST.

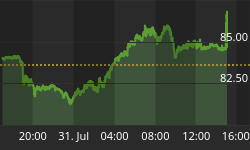
AUDUSD is turning down now, finally breaking out of an upward channel which suggest that corrective fourth wave can be finished at 0.7444 and that market is headed south for 0.7300 once again. For now invalidation level remains at 0.7511.

AUDUSD, 1H

AUD/USD 1-Hour Chart

Do you remember VIX index from a start of November, when we said that market may turn down after a three wave recovery into a trendline resistance? Well, price is now 50% lower while stocks are at new highs. But it's important to understand that this current cycle is slowly coming to an end. In other words, VIX could form a bottom in the next few months which means that stocks could turn down. And if we add the following NASDAQ chart with an ending diagonal, then we definitely should be aware of a limited upside and maybe even very strong turning point in 2017.

VIX, Daily

VIX Daily Chart

Nasdaq, Daily

NASDAQ Daily Chart


Interested in our services? Then visit our homepage at www.ew-forecast.com and take a glace at some of our charts. You can even subscribe to our Twitter account -> @ewforecast


Back to homepage

Leave a comment

Leave a comment