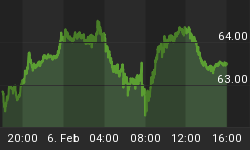
Gold and gold mining stocks have been very oversold but have struggled to rally. The sector looked to be starting a rebound until Friday's decline which pushed Gold to a new low. However, positive divergences remain in place as gold stocks and Silver remain above their recent lows. While the Federal Reserve could say something hawkish next week, the setup continues to favor a rebound in the precious metals sector rather than an immediate decline to new lows.
The monthly chart of Gold is shown below. Gold closed last week at $1162/oz after trading as low as $1157/oz. The weekly chart (not shown) shows key support (and closes) at $1158-$1165/oz while the monthly chart shows support from $1142 to $1157/oz. That range marked key support or resistance from the end of 2014 through most of 2015. It is highly unlikely that Gold does not hold this level in its current oversold state. However, that does mean Gold could test as low as $1142/oz before rebounding.

The gold stocks are in a similar position in that they could drop a tiny bit more before the start of a rebound. The daily line chart below shows the strong support in GDX at $20, which includes the 400-day moving average. GDX closed Friday at $20.67. Also, the 62% retracement is 1% below $20, at $19.80. GDXJ has been stronger as it remains a good distance above its 400-day moving average and 62% retracement. However, the chart below shows key support at $32.50, which is 5% below Friday's close.

The technicals argue that both Gold and gold mining stocks could drop a tiny bit more before starting a rebound. It would not surprise me if the sector is soft into or even immediately after the coming Federal Reserve rate hike. Once that passes, the sector could be in position to rally as expected. The coming strength would be an opportunity for traders and investors to de-risk their portfolios and raise cash for a better buying opportunity early next year. Generally speaking, we do not want to buy investment positions until we see sub $1100 Gold and an extreme oversold condition coupled with bearish sentiment.
For professional guidance in riding the bull market in Gold, consider learning more about our premium service including our favorite junior miners for 2017.


