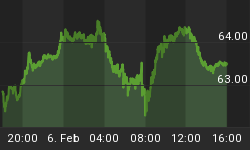
An investment reality is that neither bear nor bull markets last forever. From high, July 2014, to low, October 2016, the Agri-Food Price Index fell 23%. Since that low, this index of 18 Agri-Commodity prices has risen 19%, and is nearing a new 52-week high. If we accept the popular notion that a 20% rise from a low signals a new bull market, Agri-Commodity prices may be birthing a new bull market. Chart below is for Agri-Food Price Index over the past year.

Above chart is not the only observable hoof print of perhaps a new Agri-Commodity bull market emerging. In chart below is plotted the year-to-year percentage change for Agri-Food Price Index. Recently, that measure moved sharply higher into positive territory. That condition has not existed since beginning of 2015, when price index was basically moving down. This momentum measure is good picture of developing strength in Agri-Commodity prices.

In chart below percentage gains from 52-week lows for each of 18 Agri-Commodity prices are portrayed. While range is fairly large, average gain from lows is 31%. Thus far, 8 Agri-Commodities, or 44%, have gains in excess of 20%. As harvests in general have been good this year, demand has been source of energy for prices. For example, number three in chart is dollar price of Malaysian palm oil, which seems to have ignored forecasters most of the year. Palm oil is the most important vegetable oil to global consumers, especially in Asia. Consumer demand for this oil has been strong, pushing dollar prices up more than 30%, and Malaysian prices to multi year highs.


At heart of this price performance is demand, a topic largely ignored by many commodity traders. In chart to right, using USDA global estimates for wheat, corn, and soybeans, red bars are growth rates for demand projected over two year period beginning with 2015 and ending with crop year 2017. Growth rates for supply for same period are in green. As is readily apparent, demand growth is faster than supply, a condition that is generally supportive of prices.
With volumes in Agri-Industries strong this year due to good harvests and a turn in pricing, Agri-Equities have been rewarding for investors. In our last chart below are plotted 2016 returns to date for Agri-Equities, S&P 500, and NASDAQ Composite. Winner is fairly obvious, and not actually surprising. Agri-Equities have returned nearly double that of the NASDAQ Composite. Also note that NASDAQ 100, home of popular tired, over owned, and over priced "growth" stocks, has also failed to be competitive with Agri-Equities.

Ned W. Schmidt,CFA is publisher of The Agri-Food Value View, a monthly exploration of the Agri-Food grand cycle being created by China, India, Africa, and Agri-Energy. To contract Ned or to learn more, use this link: www.agrifoodvalueview.com   @agrifoodvv


