


The good news is:
• Seasonally this is one of the strongest periods of any year.
Short term
The seasonal tendencies at this time of year are so strong that, on a short term basis, the technical indicators do not matter.
Intermediate term
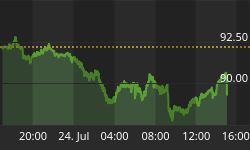
There is a troublesome trend illustrated in the chart below. Leadership has been narrowing.
The chart below shows the Russell 2000 (R2K) in red and the new high indicator (NH) in green. Vertical dashed lines are drawn on the 1st trading day of each month. NH is a 10% trend (19 day EMA) of new highs of the component issues of the R2K. New highs have been calculated over the previous 6 weeks rather than the previous 52 weeks as reported by the exchanges. For the year NH peaked in early July and currently, with the R2K only 0.6% off its all time high, NH is well off its high and falling.

Seasonality
Next week includes the last 4 trading days of the year. Since 1886 (118 years) the Dow Jones Industrial Average (DJIA) has been up 73% of the time with an average gain of 1.07% during the last 4 trading days of the year. That performance is typical of other indices over shorter periods.
During the 1st year of the Presidential cycle since 1965 the NASDAQ composite (OTC) has been down 3 times during the last 4 trading days of the year. The year following each of those 3 occurrences was also down.
Report includes the last 4 days of December.
The number following the year represents its position in the presidential cycle.
The number following the daily return represents the day of the week;
1 = Monday, 2 = Tuesday etc.
MDD = Maximum Draw Down
| OTC Presidential Year 1 | |||||
| Day4 | Day3 | Day2 | Day1 | Totals | |
| 1965-1 | -0.23% 1 | -0.70% 2 | -0.07% 3 | 0.27% 4 | -0.72% |
| 1969-1 | -0.41% 4 | -0.01% 5 | -0.27% 1 | -1.01% 2 | -1.71% |
| 1973-1 | 0.15% 5 | -0.08% 2 | 0.57% 3 | 1.36% 5 | 2.01% |
| 1977-1 | 0.56% 2 | 0.07% 3 | 0.79% 4 | 0.86% 5 | 2.28% |
| 1981-1 | 0.57% 5 | -0.72% 1 | 0.31% 2 | 0.77% 3 | 0.93% |
| Avg | 0.13% | -0.29% | 0.27% | 0.45% | 0.56% |
| 1985-1 | 0.10% 3 | -0.17% 4 | 0.18% 5 | 0.52% 1 | 0.62% |
| 1989-1 | -0.19% 2 | 0.03% 3 | 0.61% 4 | 0.61% 5 | 1.07% |
| 1993-1 | 0.06% 1 | 0.41% 2 | 0.42% 3 | 0.76% 4 | 1.65% |
| 1997-1 | 0.54% 4 | -0.25% 5 | -0.28% 1 | 0.25% 2 | 0.27% |
| 2001-1 | -0.93% 2 | 1.84% 3 | 0.72% 4 | -3.41% 5 | -1.78% |
| Avg | -0.08% | 0.37% | 0.33% | -0.25% | 0.37% |
| OTC summary for Presidential Year 1 1965 - 2001 | |||||
| Averages | 0.02% | 0.04% | 0.30% | 0.10% | 0.46% |
| % Winners | 60% | 40% | 70% | 80% | 70% |
| MDD 12/31/2001 1.85% -- 12/29/1965 1.37% -- 12/29/1981 .91% | |||||
| OTC summary for all years 1964 - 2004 | |||||
| Averages | 0.21% | 0.20% | 0.28% | 0.38% | 1.05% |
| % Winners | 68% | 54% | 68% | 83% | 76% |
| MDD 12/29/2000 3.41% -- 12/31/2002 2.69% -- 12/29/1987 2.30% | |||||
| SPX Presidential Year 1 | |||||
| Day4 | Day3 | Day2 | Day1 | Totals | |
| 1929-1 | 0.85% 4 | 1.44% 5 | 0.29% 6 | 1.25% 1 | 3.83% |
| 1933-1 | -0.15% 3 | 2.27% 4 | 2.52% 5 | -0.43% 6 | 4.21% |
| 1937-1 | -0.70% 1 | 0.41% 2 | 1.53% 3 | -0.52% 4 | 0.72% |
| 1941-1 | 0.48% 5 | 0.57% 6 | 0.67% 1 | 0.09% 2 | 1.82% |
| 1945-1 | -0.46% 3 | 1.00% 4 | 1.37% 5 | 0.00% 6 | 1.92% |
| 1949-1 | -0.72% 2 | 1.33% 3 | 0.00% 4 | -0.52% 5 | 0.08% |
| 1953-1 | 0.15% 5 | 0.57% 1 | 0.72% 2 | -0.08% 3 | 1.37% |
| 1957-1 | 0.04% 3 | -0.09% 4 | 0.45% 5 | 0.24% 1 | 0.65% |
| 1961-1 | 0.14% 2 | 0.45% 3 | 0.47% 4 | 0.10% 5 | 1.16% |
| Avg | -0.17% | 0.65% | 0.60% | -0.05% | 1.03% |
| 1965-1 | -0.10% 1 | -0.31% 2 | 0.58% 3 | 0.53% 4 | 0.71% |
| 1969-1 | 0.10% 4 | -0.39% 5 | -0.90% 1 | 0.06% 2 | -1.12% |
| 1973-1 | 0.63% 5 | 0.41% 2 | 0.54% 3 | 0.96% 5 | 2.53% |
| 1977-1 | 0.67% 2 | -0.40% 3 | 0.51% 4 | 0.54% 5 | 1.32% |
| 1981-1 | 0.51% 5 | -1.13% 1 | 0.22% 2 | 0.32% 3 | -0.08% |
| Avg | 0.36% | -0.36% | 0.19% | 0.48% | 0.67% |
| 1985-1 | -0.17% 3 | -0.43% 4 | 0.31% 5 | 0.59% 1 | 0.29% |
| 1989-1 | -0.37% 2 | 0.09% 3 | 0.84% 4 | -0.60% 5 | -0.05% |
| 1993-1 | -0.14% 1 | -0.27% 2 | 0.19% 3 | -0.71% 4 | -0.92% |
| 1997-1 | 0.64% 4 | 0.13% 5 | -0.39% 1 | -1.74% 2 | -1.36% |
| 2001-1 | 0.71% 2 | 1.04% 3 | 0.40% 4 | -1.04% 5 | 1.10% |
| Avg | 0.13% | 0.11% | 0.27% | -0.70% | -0.19% |
| SPX summary for Presidential year 1 1929 - 2001 | |||||
| Averages | 0.11% | 0.35% | 0.54% | -0.05% | 0.96% |
| % Winners | 58% | 63% | 84% | 53% | 74% |
| MDD 12/28/1937 3.55% -- 12/31/2001 1.11% -- 12/29/1953 1.01% | |||||
| SPX summary for all years 1929 - 2004 | |||||
| Averages | 0.14% | 0.34% | 0.49% | 0.22% | 1.15% |
| % Winners | 61% | 62% | 75% | 68% | 79% |
| MDD 12/28/1937 3.55% -- 12/29/1987 2.95% -- 12/28/1931 2.51% | |||||
| DJIA summary for all years 1886 - 2004 | |||||
| Averages | 0.24% | 0.23% | 0.28% | 0.33% | 1.07% |
| % Winners | 64% | 56% | 64% | 67% | 73% |
| MDD 12/28/1937 3.66% -- 12/29/1987 3.64% -- 12/28/1931 2.64% | |||||
Next year
Next year is the 2nd year of the Presidential cycle and in recent times (the past 40 years) it has been the only year of the cycle with an average negative return. The charts below show the average daily return of different indices over different periods. There are two lines on each chart, one shows the average return over all years while the other shows the average return during the 2nd year of the Presidential Cycle.
There were two compromises made in the calculations:
-
Each month is 21 trading days including the first 11 and the last 10. When there were more than 21 trading days in the month the extra days in the middle of the month are not included. Prior to 1953 the market traded 6 days a week so, during that period, days are consistently eliminated. If the month had less than 21 trading days some days in the middle were counted twice.
-
To eliminate the effect of outliers such as the crashes of 1929 and 1987 every daily move of more than 2% was reduced to 2%.
The calculations in the legends show the high, low and close relative to the starting value based on the calculations described above.
DJIA 1885 - 2005
SPX 1928 - 2005
SPX 1950 - 2005
In 1971 Nixon closed the gold window giving politicians more power to control the economy.
SPX 1971 - 2005
OTC 1963 - 2005
OTC 1971 - 2005 (gold window closed)
1982 is often cited as the beginning of the bull market that ran to 2000.
OTC 1982 - 2005
The R2K is the best representation of the small caps that we have.
R2K 1987 - 2005
The common pattern in the charts above is during the 2nd year of the Presidential Cycle the yearly high usually occurs in March or April, the yearly low usually occurs in early October and the Presidential Cycle has become more pronounced since the closing of the gold window in 1971.
On average, for the DJIA, the best month has been October up 1.2% and the worst September, down 1.9%
Conclusion
Seasonal factors trump everything else. Next week should have an upward bias on low volume.
I expect the major indices to be higher on Friday December 30 than they were on Friday December 23.
This report is free to anyone who wants it, so please tell your friends. They can sign up at: http://alphaim.net/signup.html. If it is not for you, reply with REMOVE in the subject line.


