• 497 days Will The ECB Continue To Hike Rates?
  • 497 days Forbes: Aramco Remains Largest Company In The Middle East
  • 499 days Caltech Scientists Succesfully Beam Back Solar Power From Space
  • 899 days Could Crypto Overtake Traditional Investment?
  • 904 days Americans Still Quitting Jobs At Record Pace
  • 906 days FinTech Startups Tapping VC Money for ‘Immigrant Banking’
  • 909 days Is The Dollar Too Strong?
  • 909 days Big Tech Disappoints Investors on Earnings Calls
  • 910 days Fear And Celebration On Twitter as Musk Takes The Reins
  • 912 days China Is Quietly Trying To Distance Itself From Russia
  • 912 days Tech and Internet Giants’ Earnings In Focus After Netflix’s Stinker
  • 916 days Crypto Investors Won Big In 2021
  • 916 days The ‘Metaverse’ Economy Could be Worth $13 Trillion By 2030
  • 917 days Food Prices Are Skyrocketing As Putin’s War Persists
  • 919 days Pentagon Resignations Illustrate Our ‘Commercial’ Defense Dilemma
  • 920 days US Banks Shrug off Nearly $15 Billion In Russian Write-Offs
  • 923 days Cannabis Stocks in Holding Pattern Despite Positive Momentum
  • 924 days Is Musk A Bastion Of Free Speech Or Will His Absolutist Stance Backfire?
  • 924 days Two ETFs That Could Hedge Against Extreme Market Volatility
  • 926 days Are NFTs About To Take Over Gaming?
What's Behind The Global EV Sales Slowdown?

What's Behind The Global EV Sales Slowdown?

An economic slowdown in many…

Is The Bull Market On Its Last Legs?

Is The Bull Market On Its Last Legs?

This aging bull market may…

  1. Home
  2. Markets
  3. Other

Elliott Wave Analysis: GBPJPY and EURJPY

GBPJPY

Intraday structure on GBPJPY is turning nicely bullish, now with five waves up on intraday chart above the upper channel resistance line. We will be tracking a pullback in the next few days for potential long entry, especially if we consider bullish count for USDJPY, Stocks and GBPUSD as well, so basically GBPJPY has a lot of upside potential.
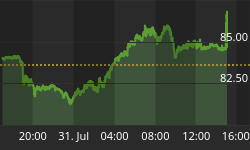
GBPJPY, 1H

GBP/JPY 1-Hour Chart


EURJPY

EURJPY has been trading higher with sharp price moves for the last few weeks, which looks like an impulse in progress on a daily time frame, so current reversal down on 4h chart is seen as a correction, a three wave move. We are tracking an A-B-C pullback in wave 4) which can be looking for a support near 120.00-120.50 area, with wave C unfolding as a potential ending diagonal. However, only a five wave bounce from that region can confirm a reversal higher into a wave 5).

EURJPY, 1H

EUR/JPY 1-Hour Chart


EW-Forecast.com has a special offer available on yearly membership, with 31% OFF.
Visite http://www.ew-forecast.com/service for details


Back to homepage

Leave a comment

Leave a comment