


This weeks daily Elliott wave analysis predicted some big moves in the price action across the markets we follow.
And again we turned up some great calls, and with those calls, a glimpse into the future on the larger Elliott wave patterns in operation in those markets.
Lets get into it shall we.
EURUSD:
EURUSD has been grinding higher in an Elliott wave pattern called an ending diagonal for the last few weeks.
On Monday I published this chart and wrote about the completion of that ending diagonal:
"The upper trendline of the ending diagonal wave 'c' is within spitting distance now, so I expect it to be hit. There is a short term divergence in evidence on the 30 minute and 4hr chart, I expect this rally is pretty much done. Watch for that upper trend line, from this point I am looking for indications of a turn to the downside."

The market went on to hit the upper trendline at a high of 1.0774 and has been rolling over ever since, down to a low on Thursday of 1.0656, a 118 point decline.

By Friday evening the price stood at a critical juncture in the wave structure that has severe ramifications if that pattern plays out, and going on the current pattern, next week will be critical.
GBPUSD:
Cable is sitting in a similar position to EURUSD, it is very vulnerable to sudden downside moves given the larger wave count in operation.
On Wednesday I wrote:
"Todays rally has possibly completed wave 'v' pink. If so we should start to se the price falter from here.
The 4hr technicals look to be topping out today, with the RSI staying under that downward sloping trendline."

The price topped out at 1.2672 and made a turn to the downside. and reached a low on Friday of 1.2513.

The Elliott wave setup is again critical at this point for GBPUSD, the price is down 159 points since the high, but the wave pattern signals something big is afoot in this pair.
USDJPY:
On Monday USDJPY triggered an invalidation level on a bullish wave count that I had been working with for the previous weeks, the price dropped 4 points below a critical low I had suggested to subscribers.
For most other analysts, a 4 point margin of error is nothing, For an Elliott wave analyst, a break of 4 points beyond an invalidation level is a world of difference and means you must change your outlook.
On Tuesday I did just that and published this chart which called for a renewed rally up to 115.62.

At that point the price stood at 112.50 and I wrote:
"So wave (c) should trace out another five wave structure to the downside to complete.
For the next day or so the price should rise in wave 'c' to complete at around 115.60."

On Friday the price reached a high of 115.37, a 287 point rally in three days. What happens from here hinges on a critical level within the current Elliott wave structure. I will be watching that level over the coming days.
The DOW:
It was an exciting week in the stock market this week.
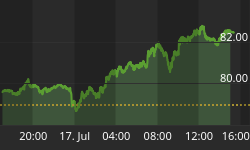
After calling the correction blow for blow over the last few weeks on Monday I published this chart, which called for a significant rally dead ahead.
I wrote:
"The DOW declined in three waves off Friday's high at 19845.
Wave ii seems to be complete at todays low and wave 'iii' should begin from here. Wave (i) grey should complete above the all time high at 19994, so the wave structure is setup for a rally this week."

The DOW stood at 20800 at the time of publishing. What happened after that is now old news!
The Dow rallied from that point to a high this week of 20134, that's a 334 point rally in three days!

The DOW has breached that mythical barrier at 20,000 and the current short term wave count calls for the advance to continue for the foreseeable future.
The really interesting point will come once this rally phase is complete, what the wave count has to say about the long term future of the stock market is nothing short of astounding, and has ramifications far beyond just stock prices.
The prudent among you will start to prepare now!
GOLD:
The GOLD market has been hit this week by a $40 decline as the rally in stocks took centre stage. This decline might have taken the investing public at large by surprise but not us Elliott wavers!
I was expecting a decline in a C wave off the recent highs with a target at 1187.
On Monday I wrote:
"wave 'c' should trace out 5 waves. The decline off the high today could be the beginning of that 'c' wave.
The target for completion is at 1187 or slightly below."

The market declined from that point and hit the target on Thursday, the low of the week was 1180!

What happens from here in the GOLD market will catch out even the most dedicated news follower, the current wave count has a surprise in store for us all, and next week could see that surprise begin!
I will be tracking it every step of the way, Its going to be interesting to say the least.


